Chapter 3: Building business models
THE STUDY
Chapter 3: Building business models

Because we selected such a broad range of media organizations for this study, we found that the best way to compare them was to divide them into four distinct tiers of business maturity, based on total revenue, number of page views, team size, and how many years they had been publishing. We used the same tiers in our 2016 report.
In expanding this study from Latin America to Southeast Asia and Africa, we decided to use the same four tiers to ensure consistency and comparative data sets between the two studies, but we’ve simplified the names this time for clarity and to make them easier to translate.
As we analyzed the media organizations in each tier separately, we found common challenges and opportunities. Although there is no single recipe for success, we did find trends across all 12 countries that provide insights into the most promising sources of revenue at each of these stages of growth.
For example, regional and national media with relatively large audiences reported higher levels of advertising support. Smaller, local, and niche media earn larger portions of their revenue from sources that leverage the experience of their founders, such as consulting and training programs.
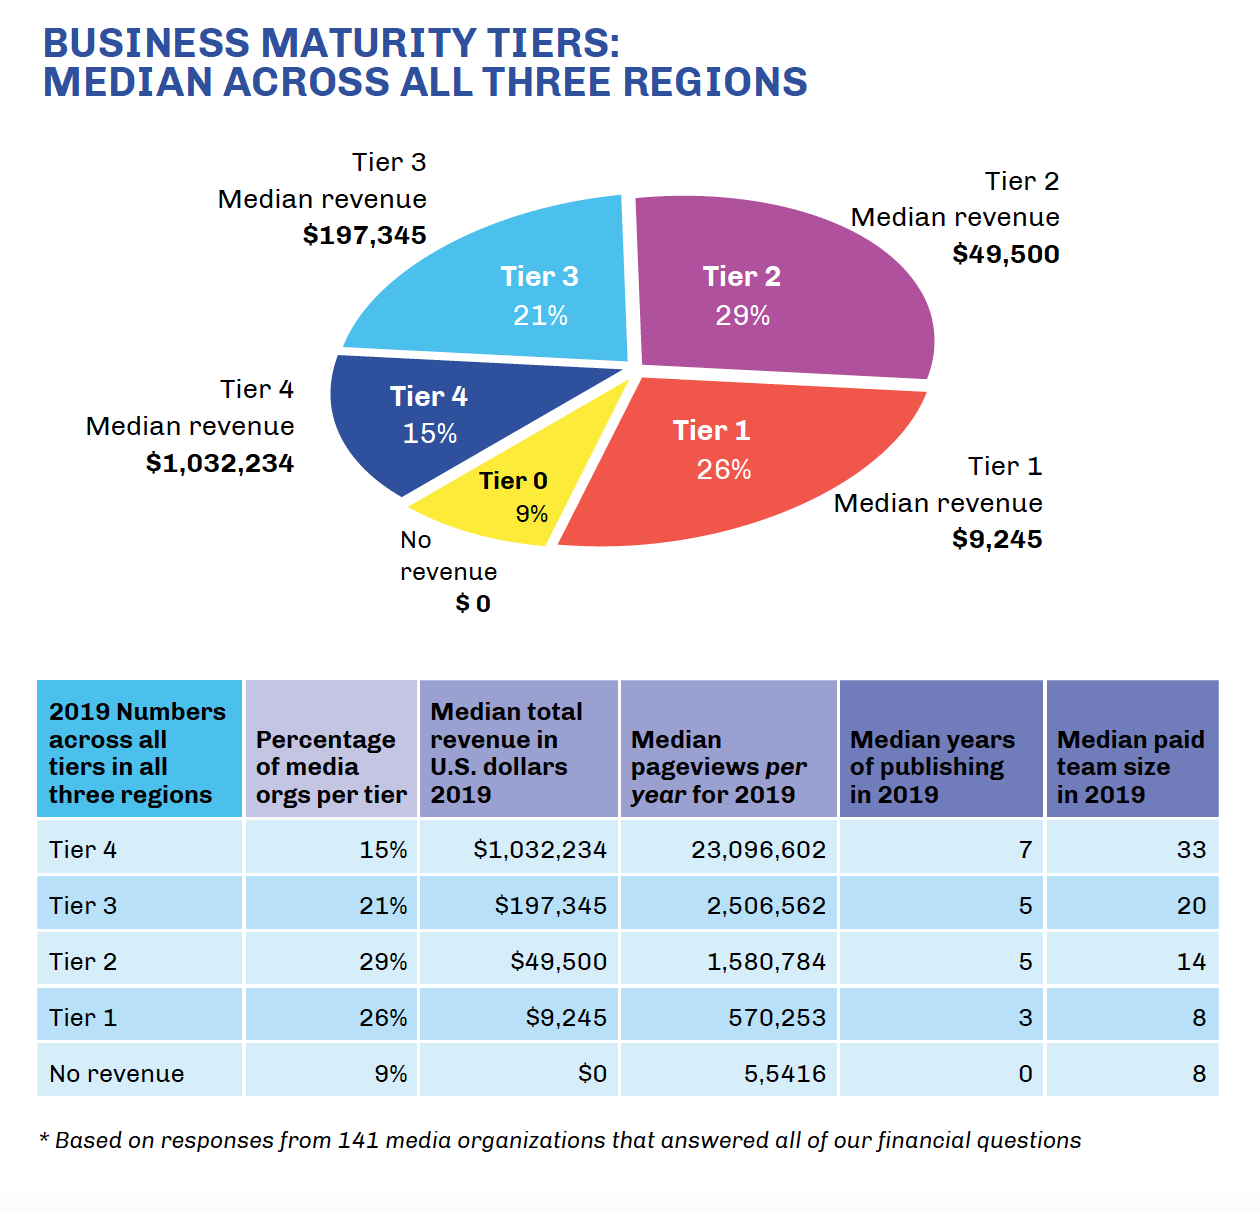
Tier 1: In our first report we named this group Startups & Stagnants because in addition to the early startups in this category, we also found organizations that were more than five years old and seemed to have stagnated, unable to grow revenue above $20,000 per year.
Tier 2: In the second tier, team size nearly doubled to a median of 14 with more than three times the traffic, and nearly five times the revenue. At this tier, with revenues of between $20,000 and $99,999, most of these media leaders were better able to cover expenses, but they still struggled to show any kind of profit. In our first report, we named these Struggling and Steady.
Tier 3: The third tier features media with multiple revenue streams, where larger teams and audiences enable higher advertising rates and audience support, and revenue ranges from $100,000 to $499,999. We named these Steadfast & Striving in our first report.
Tier 4: Media in this tier reach millions of people each month, bringing in more than $500,000 per year (with some generating well over a million dollars annually). The majority of the media in this tier reported larger audiences and larger teams, earning them the name Stars & Standouts in our first report.
More than 30 distinct revenue sources
For the purposes of this study, we created a list of 30 specific revenue sources, which we grouped into five macro categories: grants, advertising, consulting services, content services, and reader revenue.
In the following pages, we explore which revenue sources appear to work best for these digital native media at different levels of business maturity.
Note: The findings in this chapter are based only on the information we collected from the 141 media organizations that answered our detailed questions about their revenue, expenses, and initial investment. Of the 201 media leaders interviewed, 24 declined to provide confidential financial information (despite our assurance of confidentiality), and 36 were unable to answer all of the financial questions.
Founders start with limited resources, but they don’t give up easily
Most of the 201 media in this study were started with less than $15,000 in initial investment, and their limited resources make building a sustainable business model challenging.
Yet, compared to other types of entrepreneurs they show surprising longevity. According to data from the U.S. Bureau of Labor Statistics, about half of all business startups fail before they reach their fifth year of operation.
In comparison, when we started this research in 2021 and went back to look at the 100 media we studied in Latin America in 2016, only 23% had ceased publishing. Most of them were in Argentina, where inflation reached 50% during the economic crisis that followed the pandemic lockdown.
This low failure rate is consistent with what we’ve seen after six years of mapping Spanish-language digital media across more than 20 countries for our media directory at SembraMedia. As of this writing, our directory features 968 media organizations that are actively publishing. Over the years, we’ve removed 217 (or about 28%) because they ceased publishing for more than six months.
On of the oldest media organization in our directory, El Faro in El Salvador, started in 1998 and was run exclusively by volunteers during its first five years of operation. In the last decade, El Faro has grown into an internationally recognized news source, with a paid team that includes reporters, editors, sales and business staff.
Most digital natives in this report fall in the bottom tiers
More than 60% of the digital native media organizations we studied either fell into the bottom two tiers of business maturity or made no revenue at all in 2019.
This sets an important context for all the findings we share here: many of these digital media entrepreneurs operate with little financial security, and their limited resources make investing in business development challenging.
Most are so dedicated to their mission of public service journalism that they often neglect other aspects of building a sustainable media organization, like accounting or product development.
Yet the relative success of the media we studied in the higher tiers, and the growth we’ve seen in Latin American media since our first study, suggests media in these bottom tiers have the potential to grow.
But it’s important to acknowledge that helping journalists build stronger business models takes time, and further growth would likely require greater resources than most of them start with.
Does age matter?
Although the older media in this study were more likely to attract larger audiences and earn more revenue, age was not always the determining factor.
As you might expect, many of the media in the bottom tier are young startups and had been publishing for less than two years when we selected them for this study. But we also found that some of the media in the bottom tier had been publishing for more than a decade and seemed stuck. Similarly, some of the media in the top revenue tier were surprisingly young.
As we explain later in this report, the amount of initial investment they started with was an important indicator of future success.
Media grew faster in Southeast Asia thanks to higher startup capital
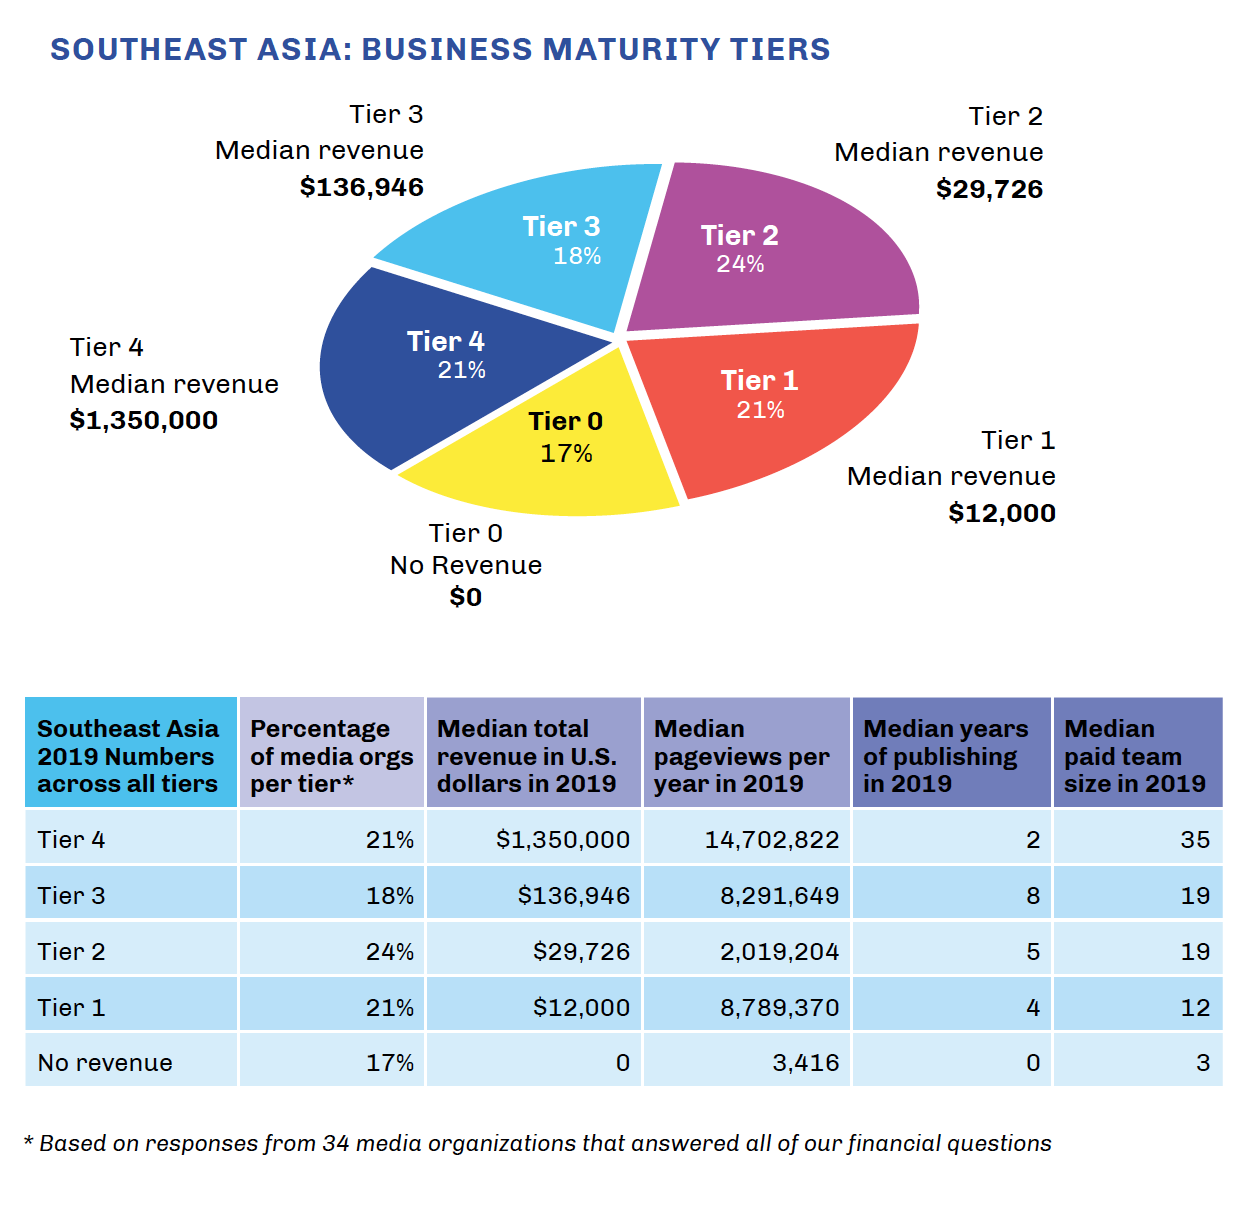
In Latin America and Africa, there was a correlation between the number of years these media organizations had been publishing and their level of business maturity, but in Southeast Asia, we found an anomaly. The media in the top tier reached the highest revenue level after an average of just two years of operation.
In contrast, the median age for media in the top tier in Latin America was nine years, and in Africa it was seven years.
It should be noted that the majority of the top tier sites in Southeast Asia were from Thailand, but our analysis revealed a few other clues about what could be driving this early success: all of the media in the top tier in Southeast Asia received significantly higher initial investment than media in other regions. (See sidebar for more on this).

On average, top-tier organizations in Southeast Asia had five staffers devoted to sales or business development. In this region, having at least one person dedicated to this area increased revenue sixfold.
In contrast to many other organizations in this study, none of the top tier media in Southeast Asia reported receiving grants from private corporations, and only one had received a grant from a philanthropic investment organization.
Instead, the media in the top tier in Southeast Asia relied primarily on local and national advertising, content creation for non-media clients, consulting services, and subscriptions (in that order).
Overall, the digital native media we studied in Southeast Asia were fairly evenly split between the four revenue tiers, although the majority (24%) were in Tier 2, where median revenue was $29,726.
Early investment in talent key to driving rapid success in Thailand
Although the founders of the news sites Echo and The Standard in Thailand started with higher levels of early investment, both said that investing heavily in talent was key to their rapid success.
For the Standard, founded in 2017, attracting top talent has been fundamental to the company’s early years as it sought to build its brand, grow a readership base, and contribute positively to society.
Founder Nakarin Wanakijpaibul said, “The initial investment helped us to get the cream of the crop within our industry. Our talent core might not be as big compared to bigger media organizations, but it was enough for us.”
The most creative minds produce high-quality content that can communicate directly with the audience, which is key to the Standard’s advertising-supported business model. To maintain talent, Wanakijpaibul said his team strives to create a working culture that fosters self-improvement and nurtures autonomy and agility.
For Echo, founded in 2018, the recipe for success emphasizes both talent and big data. It’s no longer “content is king,” but rather “content and data is king”, said founder Rittikorn Mahakhachabhorn. Fifty percent of the success is talent that can make quality content, but the other 50% is big data telling them how the content should be presented, the founder said.
Echo’s in-house research shows that having subtitles in their content helps drive popularity because people like to consume Echo content on mobile phones in public spaces where they do not want to turn the sound on. Having subtitles gives their audience the freedom to choose when and where to watch Echo videos and drives the type of reach that attracts their national advertisers.
Digital native media in Latin America have grown since 2016
Our first Inflection Point study provided valuable insights into how 100 digital media entrepreneurs were covering the news, building business models, and serving their communities in Latin America in 2016, even as they faced myriad threats and attacks.
In this new report, we used that historical data to explore how digital native media changed between 2016 and 2019. We found that 75% of the media we interviewed for both studies reported revenue growth—and some were bringing in a lot more money.
Before we explore these findings in detail, we should note that in addition to the 23 that had ceased publication, we cut 21 of the media in our original sample because they didn’t meet our stricter criteria, or we couldn’t schedule interviews in time. As a result, the findings in this section are based on a comparison of 40 media organizations that were included in both studies.
While we recognize that this is a relatively small sample for comparison, the fact that we found so many better candidates to replace the ones we removed also demonstrates the growth and maturation of the overall digital native media market in Latin America.
Growing revenue and rising through the tiers
In the first Inflection Point study, the majority of the digital native media organizations we interviewed in Latin America were in the lowest tier, with median annual revenue of less than $20,000 in 2016.
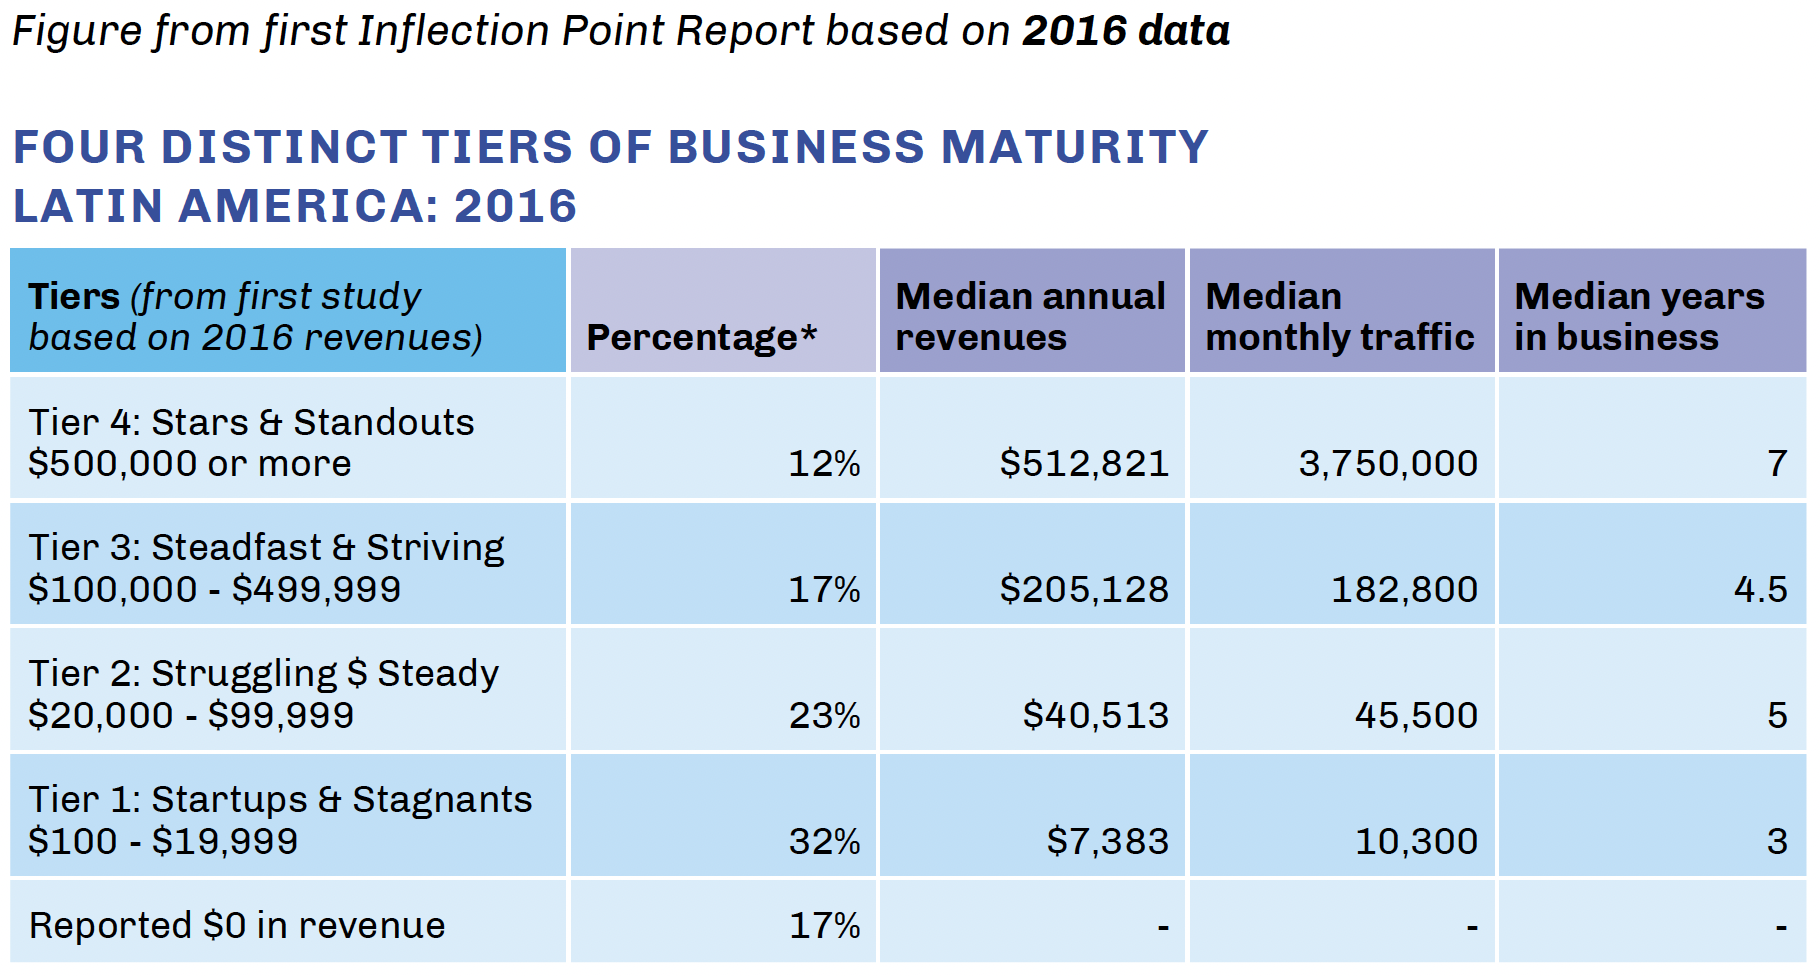
In 2019, we found that more than 20 of those had grown enough between 2016 and 2019 to reach a higher tier in our four-tier model. The following figure shows how media in Latin America fit these tiers in 2016. The figure after that shows how the media we interviewed for this report fared in 2019.
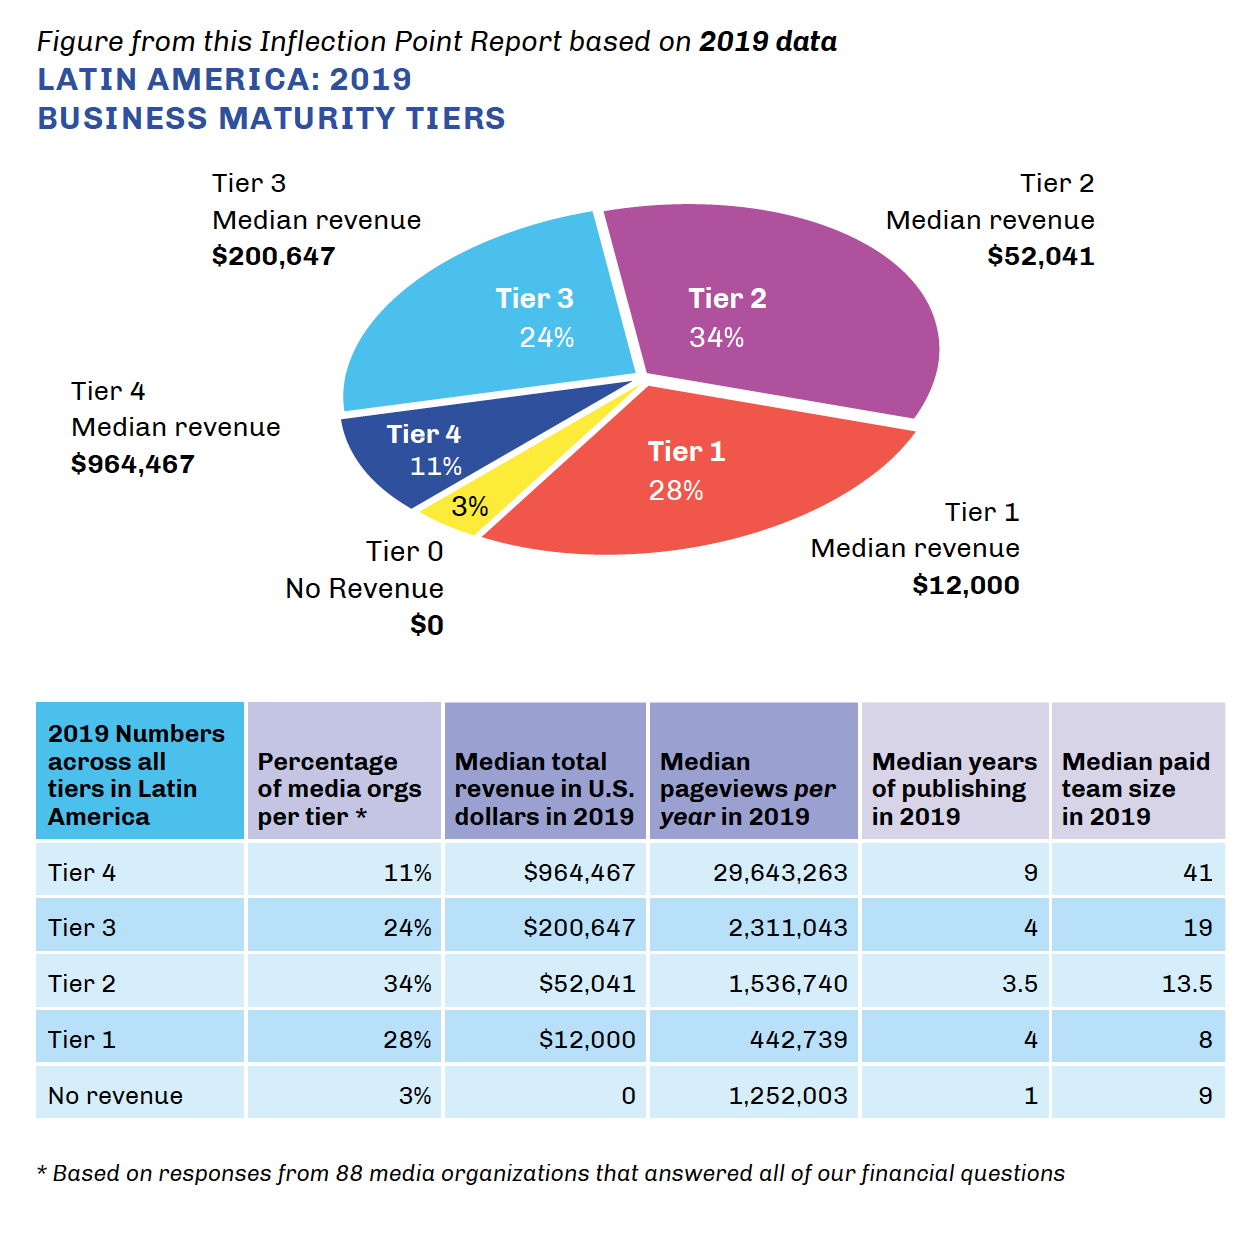
The most dramatic growth appeared in the top tier, where median annual revenue jumped from about $500,000 in 2016 to nearly $1 million in 2019. We attribute this, in part, to the higher initial investment media leaders started within this tier, as well as increases in revenue we found across all five of the macro revenue categories.
A few highlights:
- In 2016, 17% of media organizations we interviewed in the region were making no revenue at all. Three years later, this figure had shrunk to just 3% of the media included in this study.
- In 2016, 32% of digital native organizations in our Latin American sample were in Tier 1. This percentage had dropped to 28% in 2019.
- In 2016, 17% of ventures were in Tier 3, generating $100,000-$499,999 in revenue. In 2019, 24% of the organizations we included were in this category.
- In 2016, media in Tier 4 reported median revenue of $512,821. In 2019, the organizations in this top revenue category reported median income of $964,467.
Challenges collecting financial data in Africa
Before we look at the business maturity of the media leaders we interviewed in Ghana, Kenya, Nigeria, and South Africa, it is important to note that our researchers faced considerable challenges when collecting data from interviewees in Africa. These interviews were done in while many were still on lockdown or limited travel because of the pandemic. A further complication was that the limited bandwidth in many parts of these African countries made it hard for our researchers to conduct video interviews, so many had to be done by mobile phone.
Researchers reported that it was especially difficult to get answers to all our financial questions because many of the media leaders they interviewed had never been asked these types of questions about revenue and expenses before. In some cases, researchers told us their subjects simply did not know how to answer, because they lacked the data or were not tracking the metrics we requested.
In some cases, even when they knew the answers, despite reassurances that we would only share aggregate anonymized data (not their private data), some were hesitant to share detailed financial information. Our local researchers hypothesized that this could be due to a reluctance to reveal all of the sources of their funding, or the state of their finances.
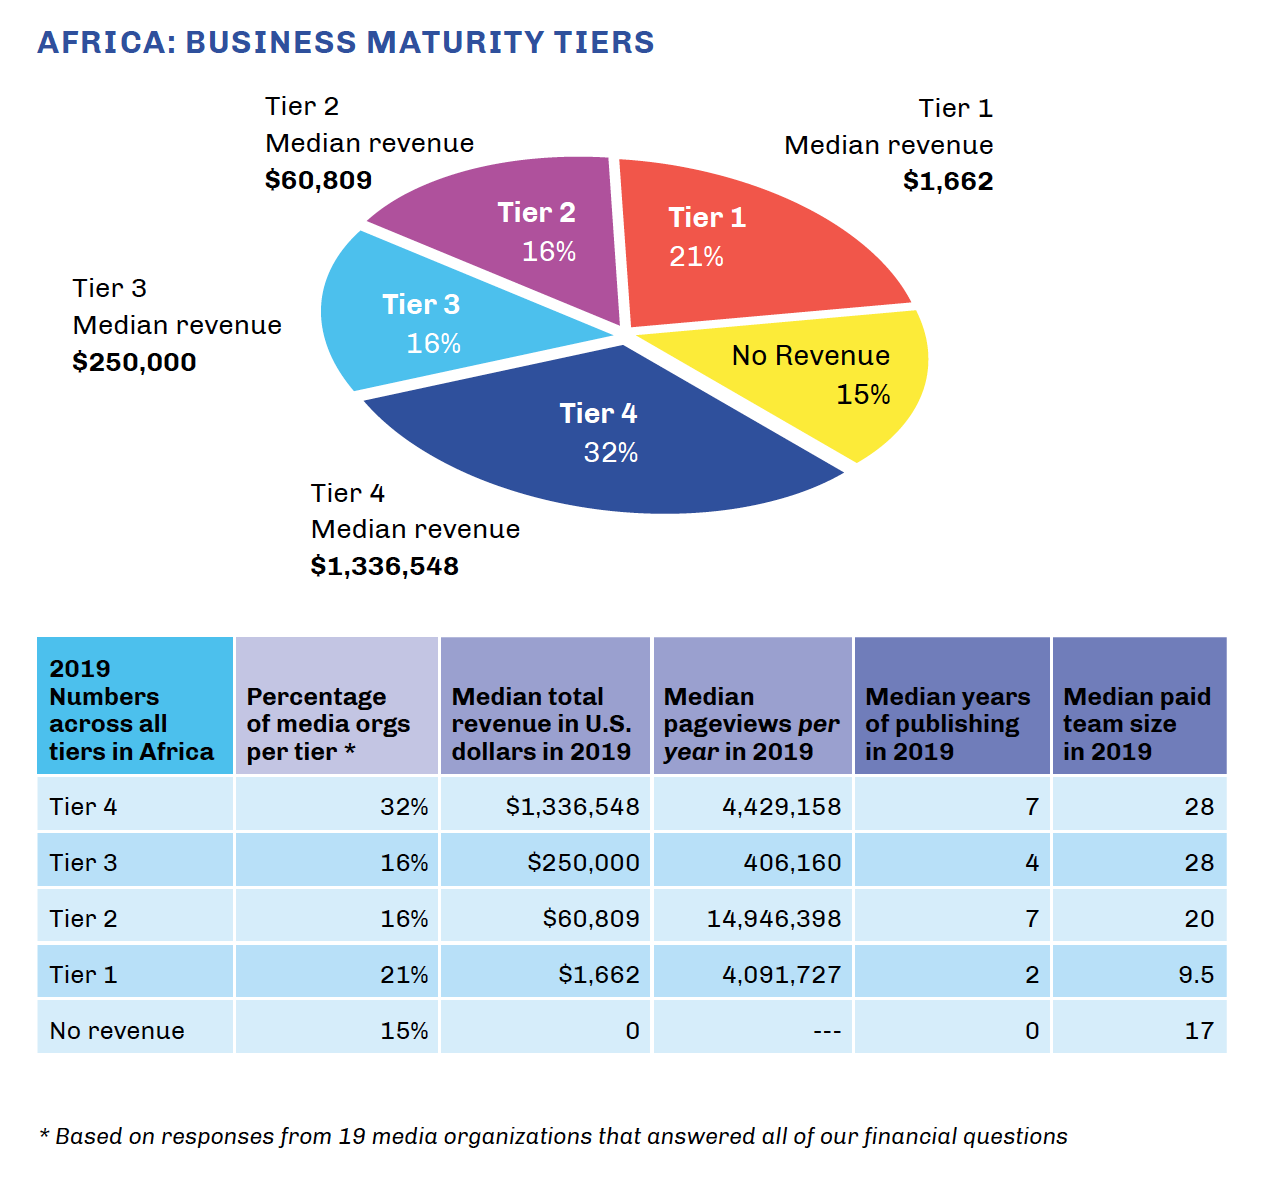
Consequently, only 19 out of the 49 African newsrooms we interviewed provided financial data that was complete enough for us to include it in our analysis.
Media in Africa reach top tier with lower pageviews
More than 30% of the digital native media organizations that shared financial data with us in Africa reported revenue of more than $500,000 in 2019, landing them firmly in Tier 4.
However, owing to the data collection challenges outlined above, we believe it could be misleading to use this as a broader indication of success in the region. It may be that the most successful organizations in our sample felt more comfortable sharing their financial data or simply had better financial records, which would tend to skew the overall results.
That said, it is interesting to note that the median number of annual page views for the African media in this top revenue tier was just a fraction of the page views required to achieve these revenue levels in other regions: the median was only 4.4 million page views per year among these top media in Africa, compared to 14.7 million in Southeast Asia, and 29.6 million in Latin America.
Our researchers suggested that the lower page views relative to revenue in Africa may be due to the fact that some of these organizations are niche sites, which receive larger amounts of grant funding.
Higher initial investment is an indicator of future success
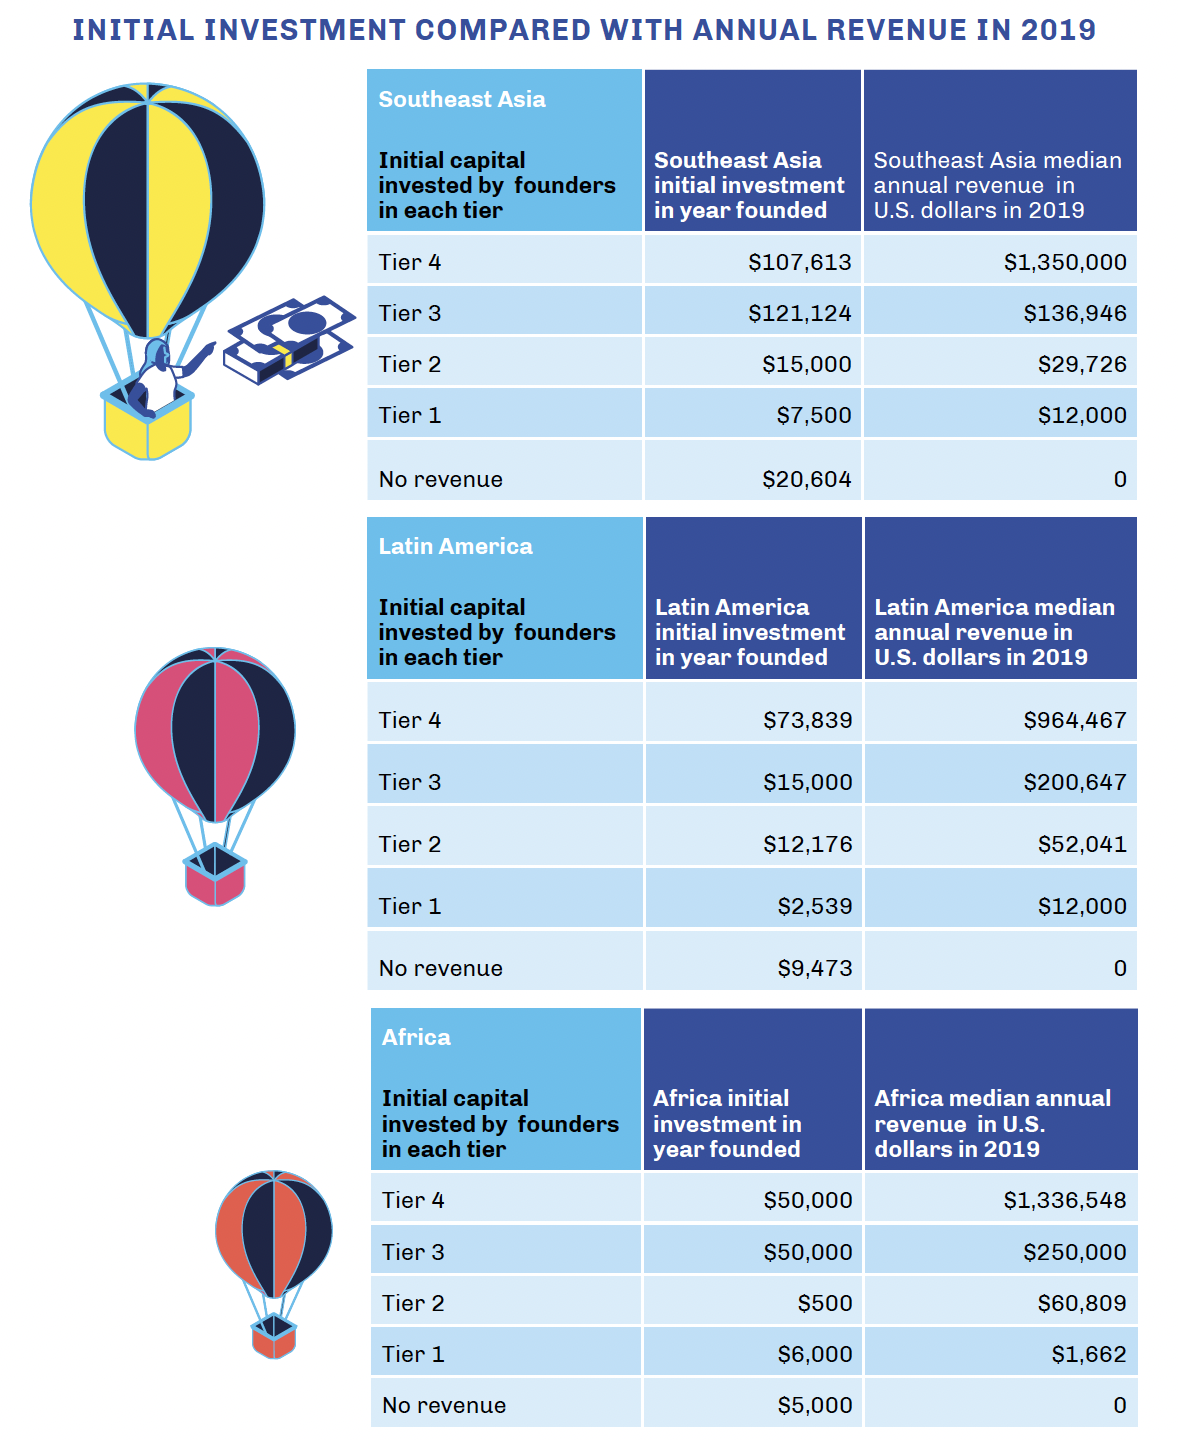
Our research revealed that media in Tier 4 started with three times more initial investment than those in Tier 3, and this pattern held true down the tiers.
Most of the organizations in this study started with relatively little capital and few resources: across all of the tiers in all three regions, the median initial investment these media leaders had to start their news organizations was only $14,774.
In comparison, the median initial investment in Tier 4 was $50,000. In 2019, all of the media in this top tier reported annual revenue of more than $500,000, and the median was more than $1 million.
When we looked at initial investment by region, we found that in Latin America those in the top tier started with nearly five times more funding when they launched than ventures in the next tier down, although these differences became much smaller in the lower tiers.
In Africa and Southeast Asia, the picture was a little more mixed: the category of Southeast Asian organizations with the highest level of initial investment was Tier 3, while in Africa, sites in the top two tiers started with the exactly same median amount of initial investment. The following figure provides for a detailed breakdown of how these regional differences in initial investment related to annual income in 2019.
Top revenue sources for digital native media
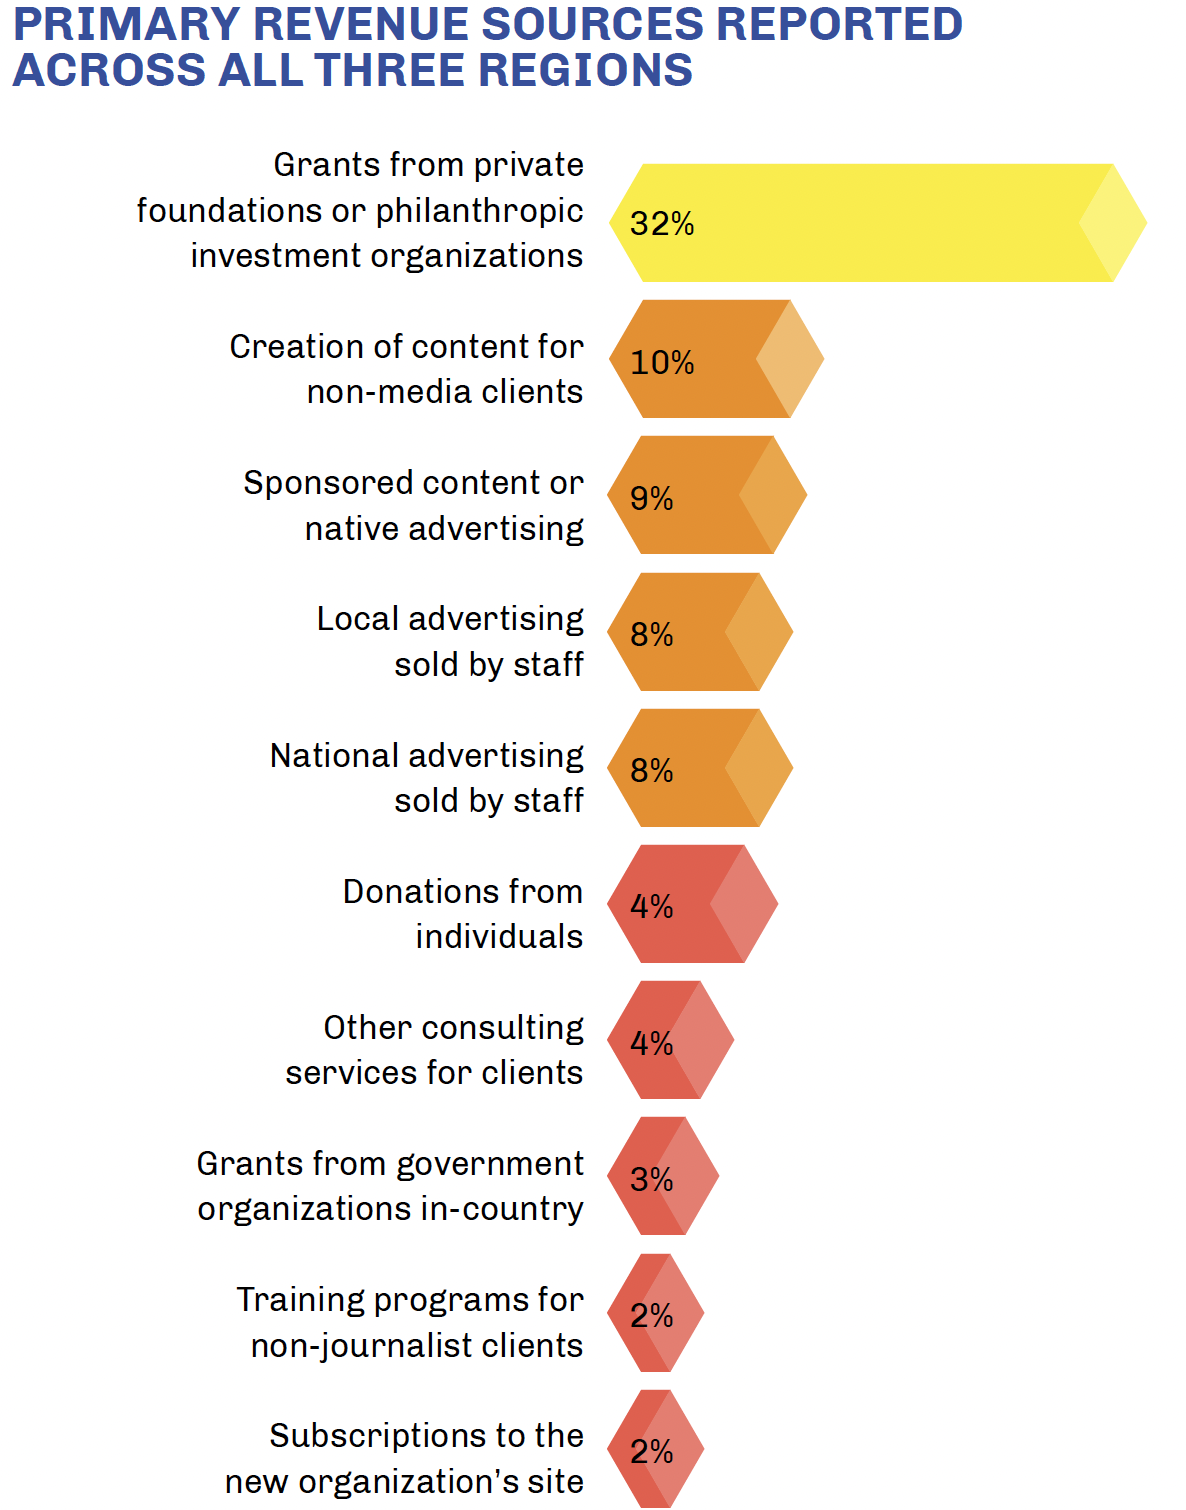
Across all of the media in all three regions in this study, in both 2019 and 2020, the top revenue categories were grants, advertising, consulting services, content services, and reader revenue, in that order.
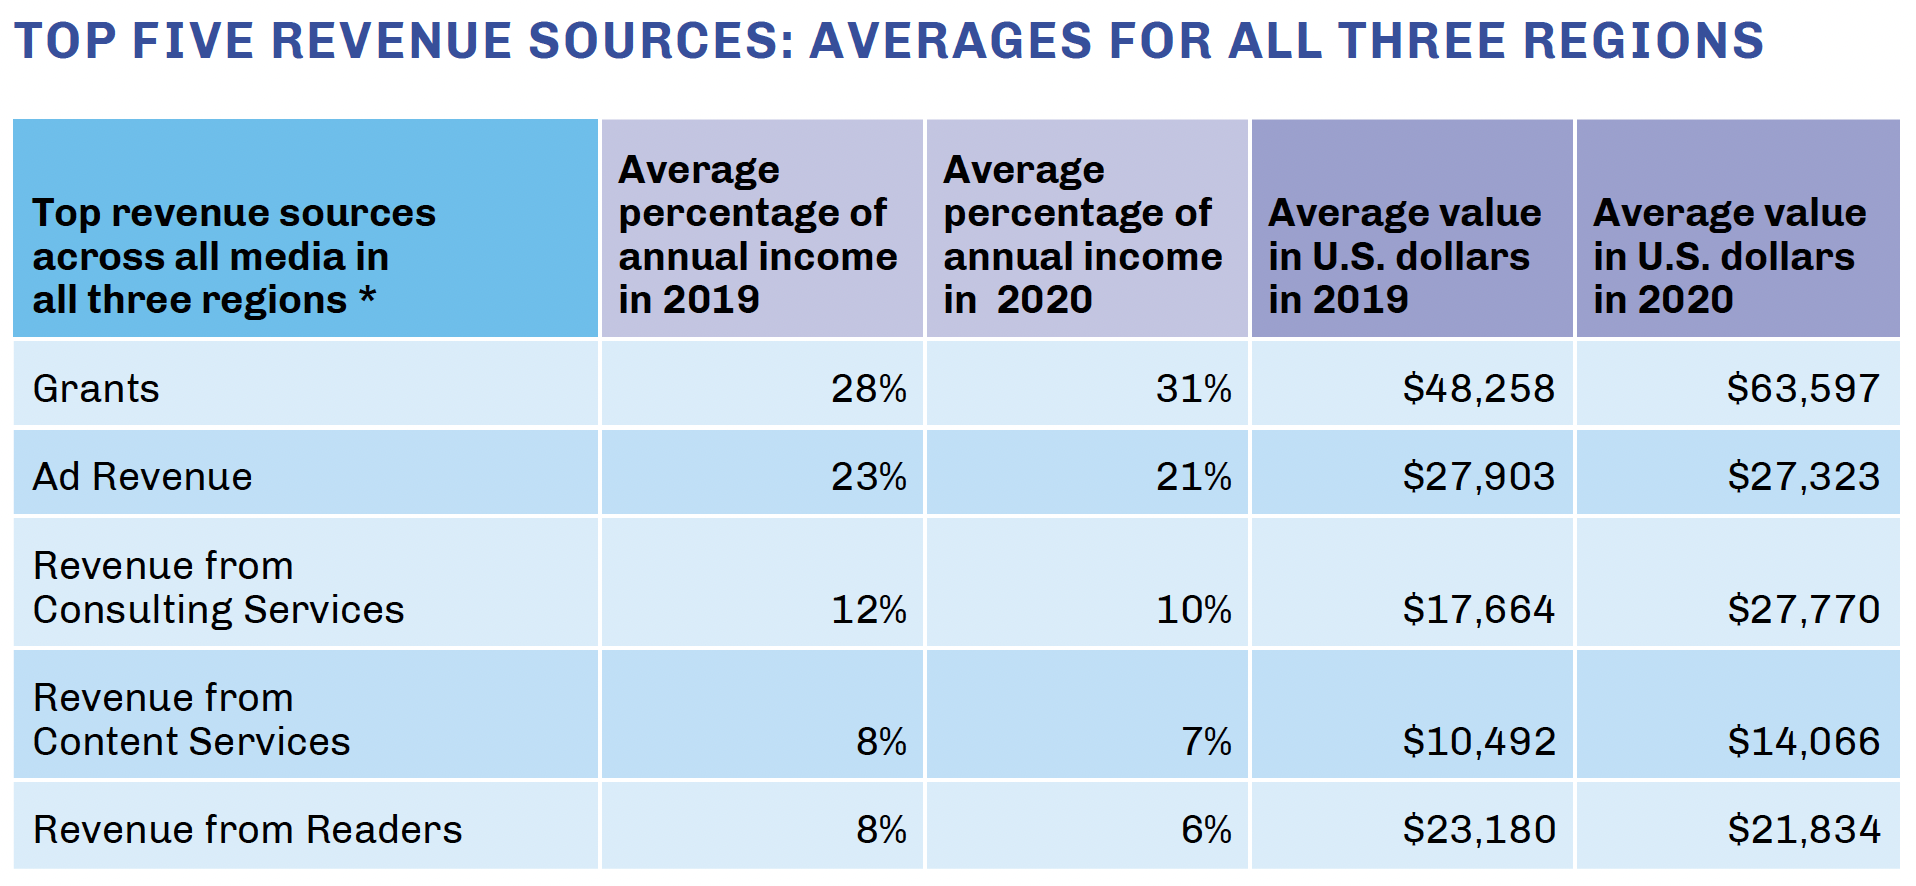
In our interviews, we asked media leaders to select all of their revenue sources from a list of 30 different kinds of income. We then asked them to identify the source that provided the most revenue.
* To better understand and compare the types of revenue, we grouped similar sources into the following five macro categories:
- Grants: Includes all grant funds from private foundations, philanthropic investors, private corporations, as well as grants from foreign and national government organizations.
- Ad revenue: Includes all ad sources reported, including Google AdSense, affiliate ads, programmatic ad networks, sponsored content and native advertising, and ads sold by agencies or staff.
- Consulting services: These include a range of services, such as communications and social media consulting, research projects, and special commissions by NGOs.
- Content services: Includes all revenue from content syndication, unique content created for other media, content created for non-media clients, and design or tech services.
- Revenue from readers: Includes subscriptions, membership fees, newsletter subscriptions, site subscriptions, donations from individuals, crowdfunding, and event ticket sales.
Diverse revenue is key, but having more sources is not always better
Developing diverse revenue sources is key to editorial independence and financial success, but in this research, we found that having more sources is not necessarily better.
For the digital native media organizations we spoke with, having less than three revenue sources was likely to put them in the bottom third of income earners, but having more than six income sources did not consistently increase revenue when compared with other similar-sized media organizations.
The ideal number seems to be between two and six distinct revenue sources. This finding leads us to a warning for media leaders not to try and develop too many revenue sources at once because it can be counterproductive.

Grant funding was the #1 source of revenue
Grant funding was the primary type of revenue when averaged across all of the media in this study. In 2019, grants accounted for 28% of revenue. In 2020, grant funding increased to almost 31%.
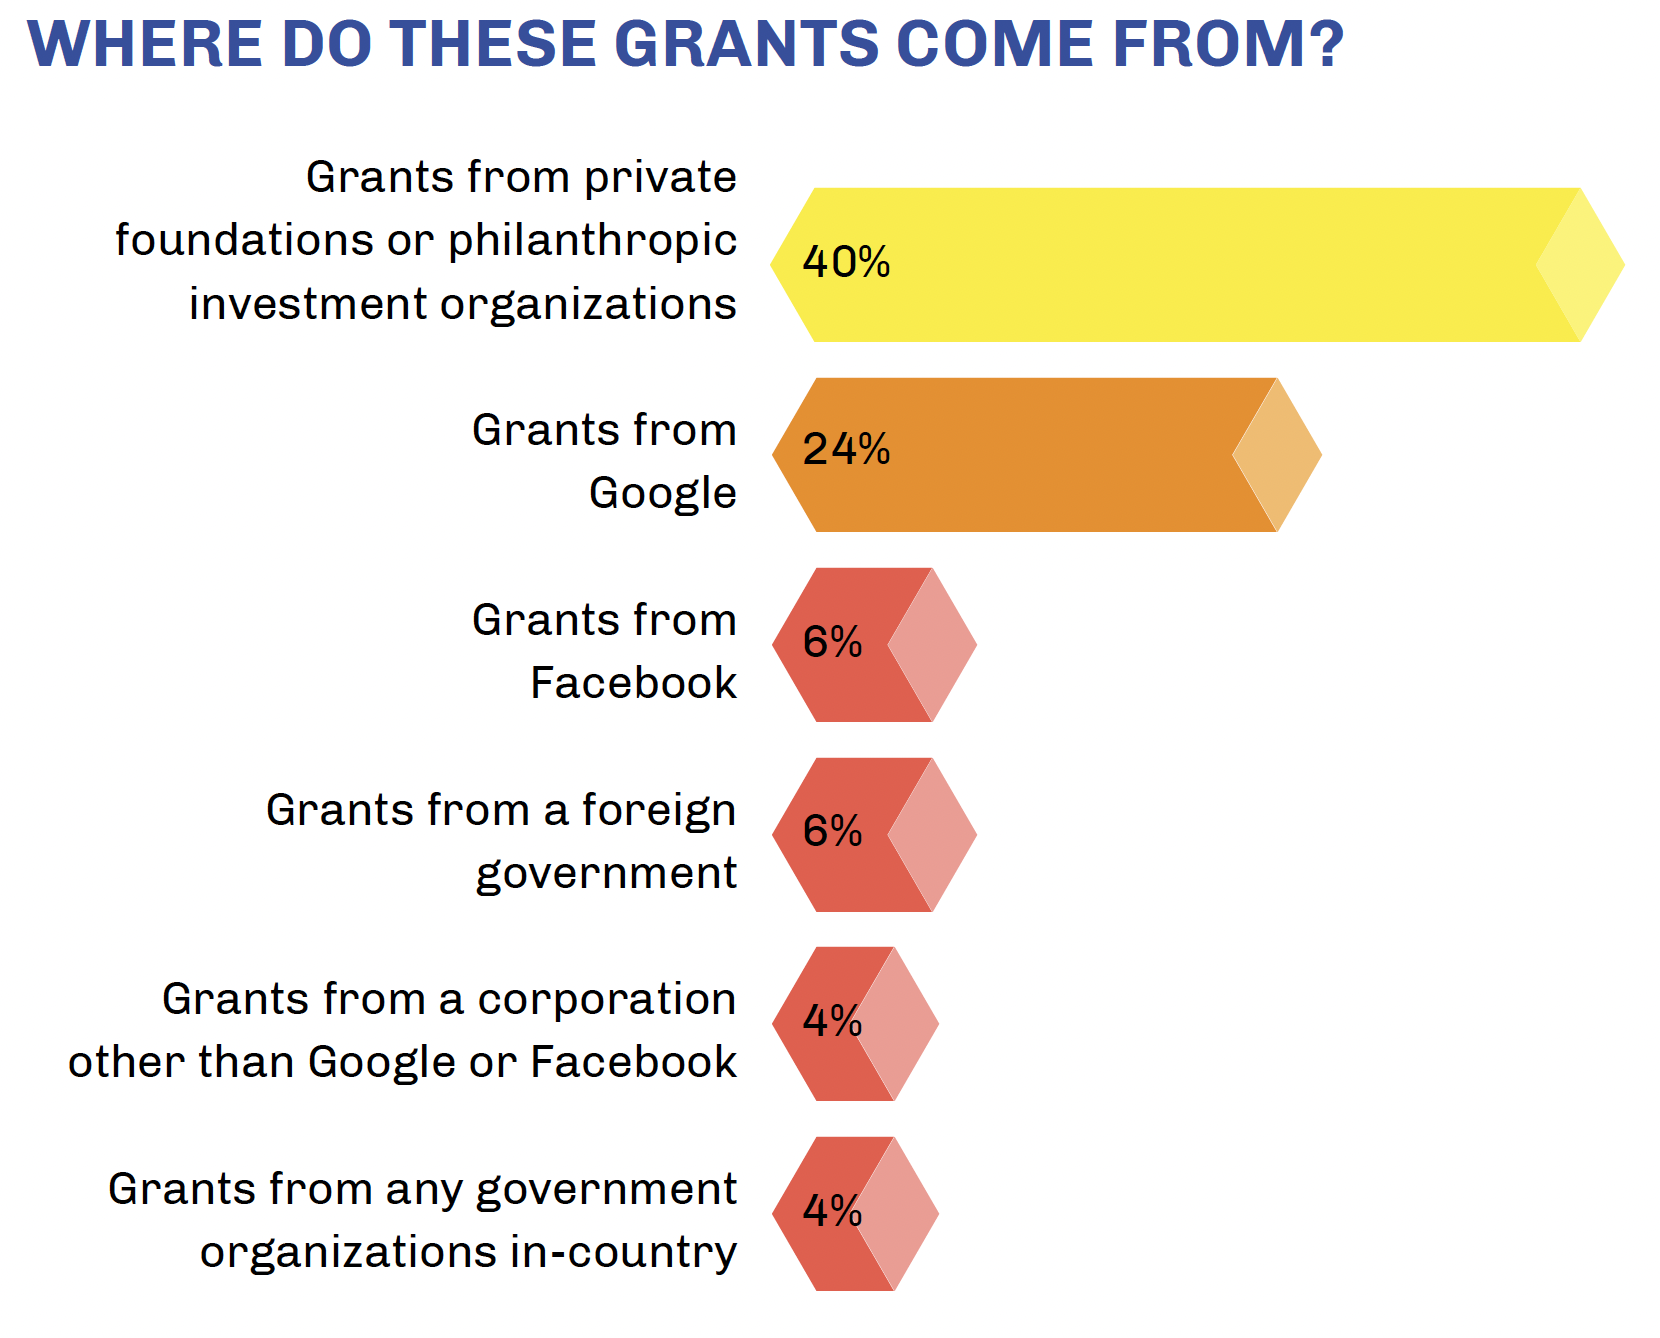
Private foundations and philanthropic investment organizations were the most commonly reported source of grant funding, followed by grants from private corporations (most notably Google and Facebook), then foreign governments, and finally domestic government organizations.
Average grant revenue by region
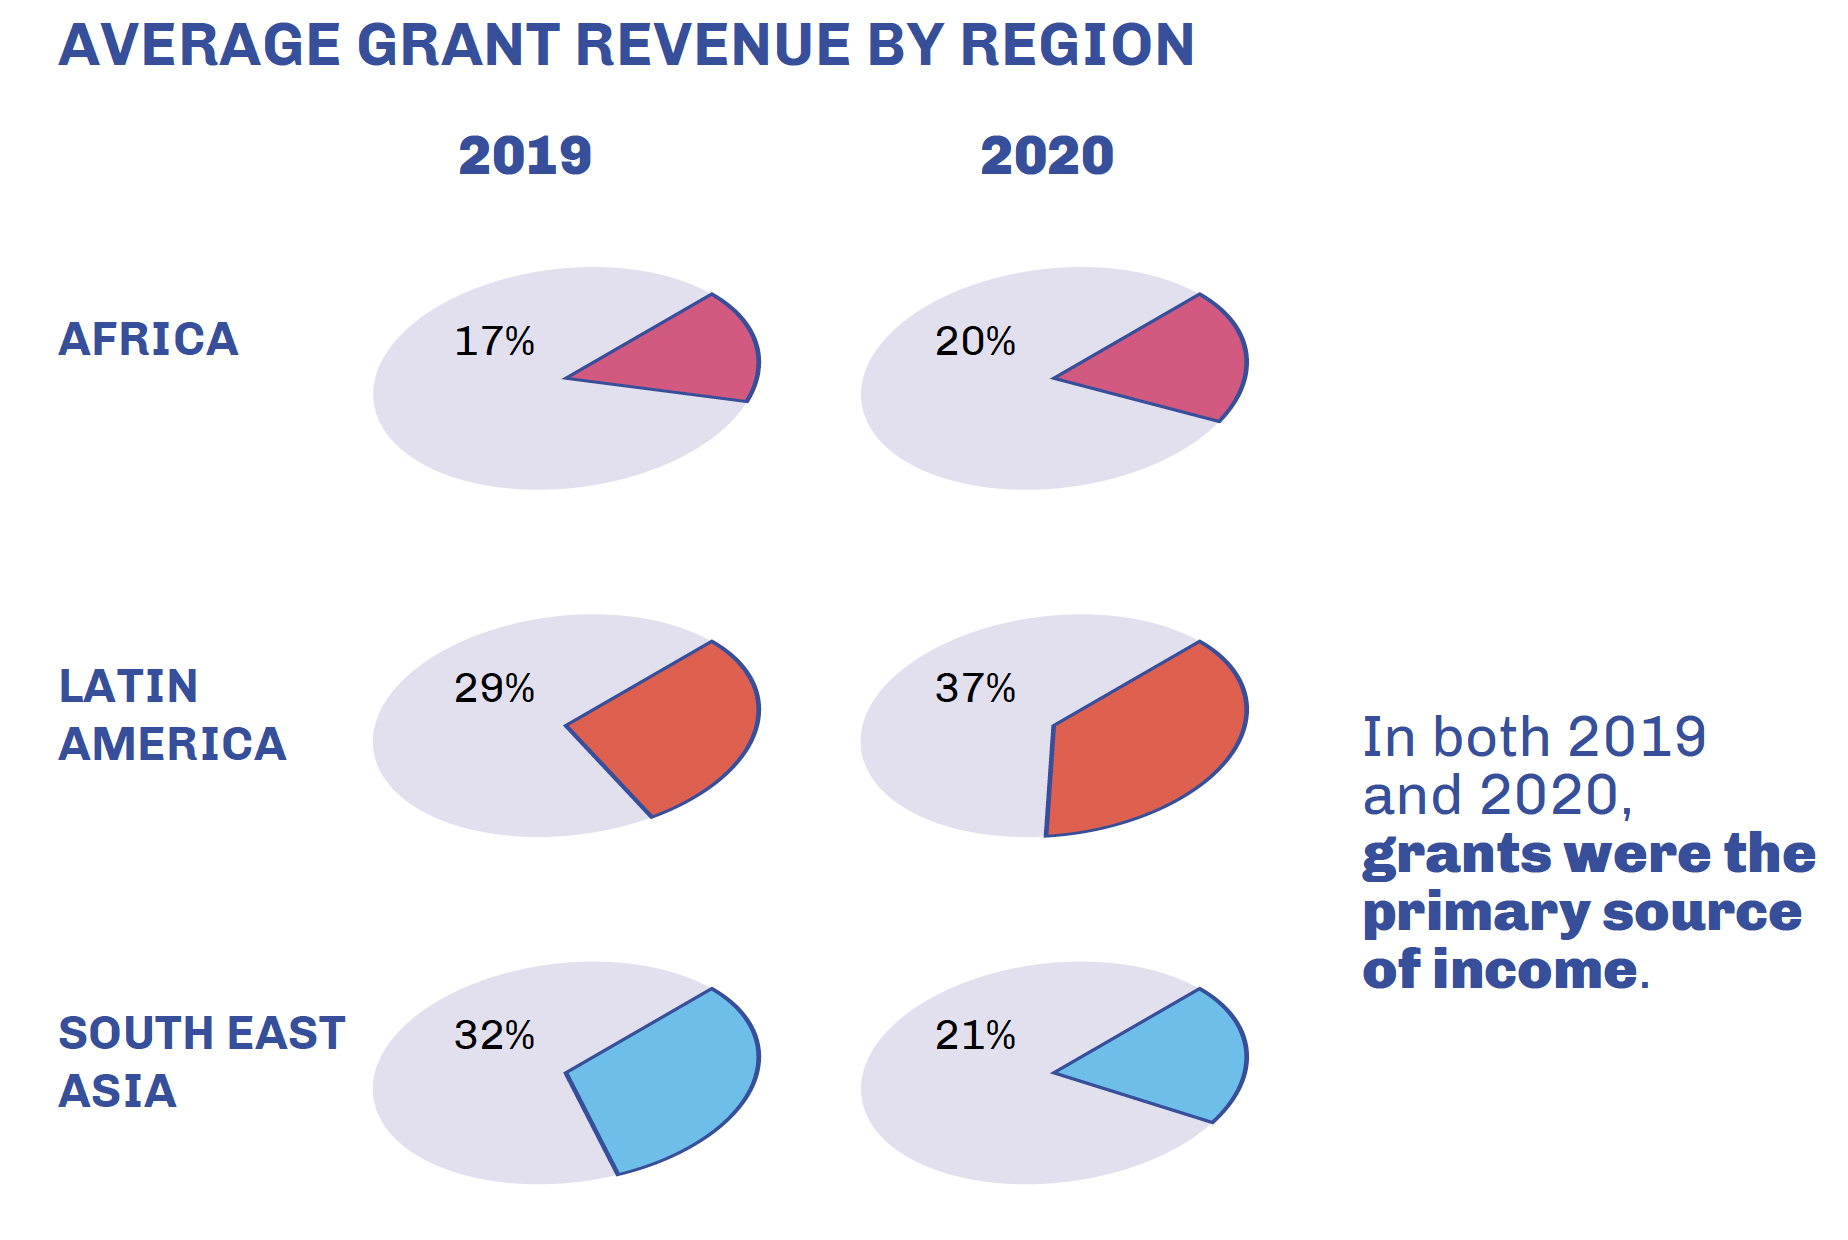
In both 2019 and 2020, grants were the primary source of income.

It should be noted that because we sought out organizations for this study that were not overly dependent on local government sources, the low levels of government funding are not representative of what other media may be receiving in these markets. Similarly, the relatively small overall budgets of the media in this study means that even small grants (in the $5,000 to $10,000 range) can have an impact.
Breaking down revenue sources by tier, grant funding from private foundations and philanthropic organizations was the primary source of revenue for the media in Tiers 2, 3, and 4 in 2019 and 2020.
In Tier 1, private foundations and philanthropic organizations were the primary source of revenue in 2019, but this source was overtaken slightly by other donations in 2020, suggesting that a growing number of organizations across all tiers received additional help in the face of the pandemic.
Grants leapfrogged all other sources of funding to become #1 revenue category in LatAm
In Latin America, grant funding accounted for 29% of revenue in 2019, and 37% in 2020. The increase between these two years likely reflects the increased amount of grant funding that was made available to media organizations as the COVID-19 pandemic took hold and media around the world reported dramatic losses in revenue, especially in advertising and events. (More on this later in the report).
The level of grant funding we found in Latin America is even more striking when you consider that grants were not reported as a significant source of revenue in our 2016 study. In that year, only 16% of the media we interviewed in the region reported receiving grants. Instead, the most common sources of revenue in 2016 were training services, programmatic advertising, consulting services, native ads and branded content, and banner ads.
Although the most frequently reported source of grant money in Latin America in 2019 and 2020 was from private foundations or philanthropic investment organizations, grants from Google came in a close second and were reported by 41% of the entrepreneurs we spoke with in the region.
Grant funding was the #1 source of revenue for Southeast Asia in 2019 – but not in 2020
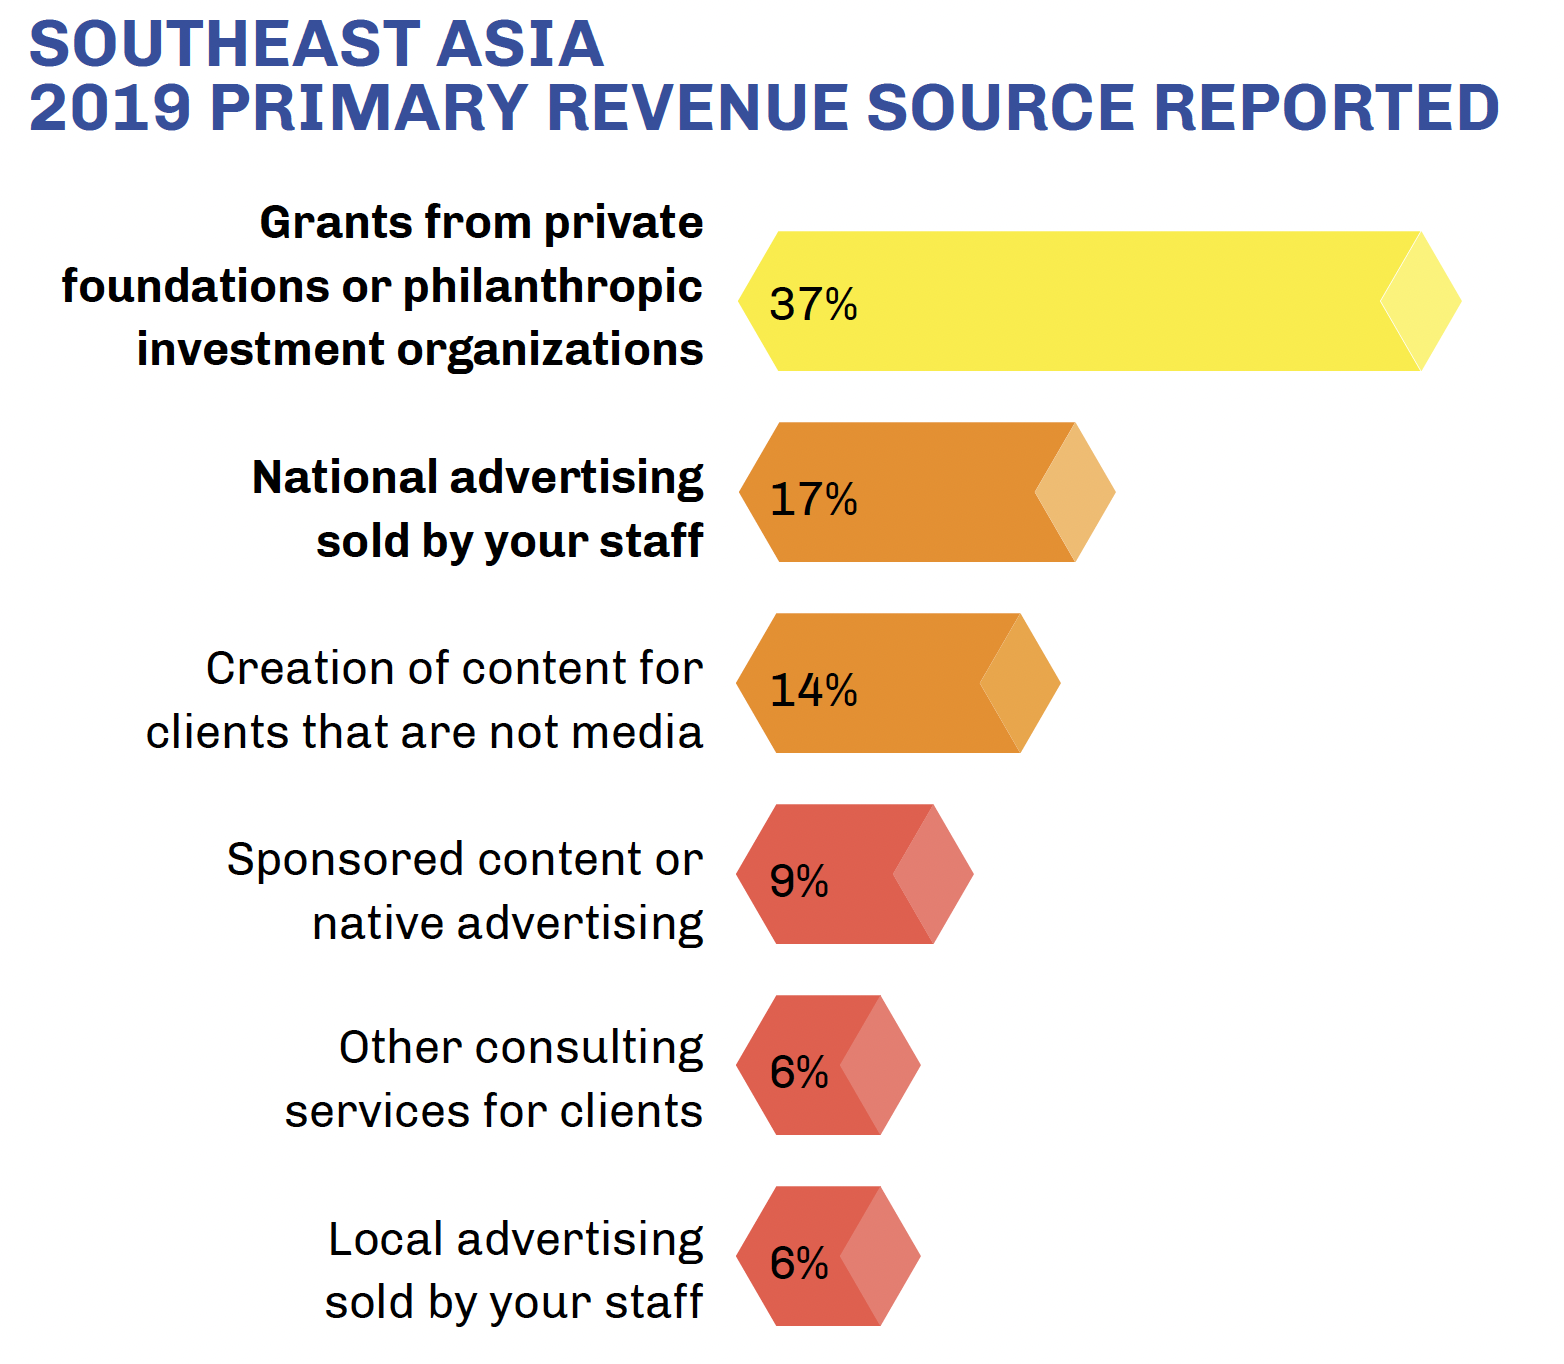
Similar to our findings in the other regions, grants from private investors and philanthropic organizations were the most commonly reported primary source of revenue for the media organizations we spoke to in this region for 2019.
However, when we looked at the detailed financial information we collected, the picture became a little more complex.
In 2019, grant funding was the primary revenue source for digital native media we spoke to in Southeast Asia, and accounted for almost 32% of all revenue that year (compared to around 29% for consultancy, 24% for ads, and 8% for reader revenue).
However, in 2020 grant funding dropped to 21% of all revenue, with ads accounting for the lion’s share of revenue that year (26%). Reader revenue also dropped slightly in the region during 2020, to 7%.
This bucked the trend in the other two regions, where the percentage of grant funding increased between the two years, and advertising dropped slightly. And yet the average amount of grant funding received by Southeast Asian media organizations increased slightly from 2019 to 2020, from an average of $10,314 to $11,091 per media organization.
Ads lead over grants in the comparatively smaller African sample
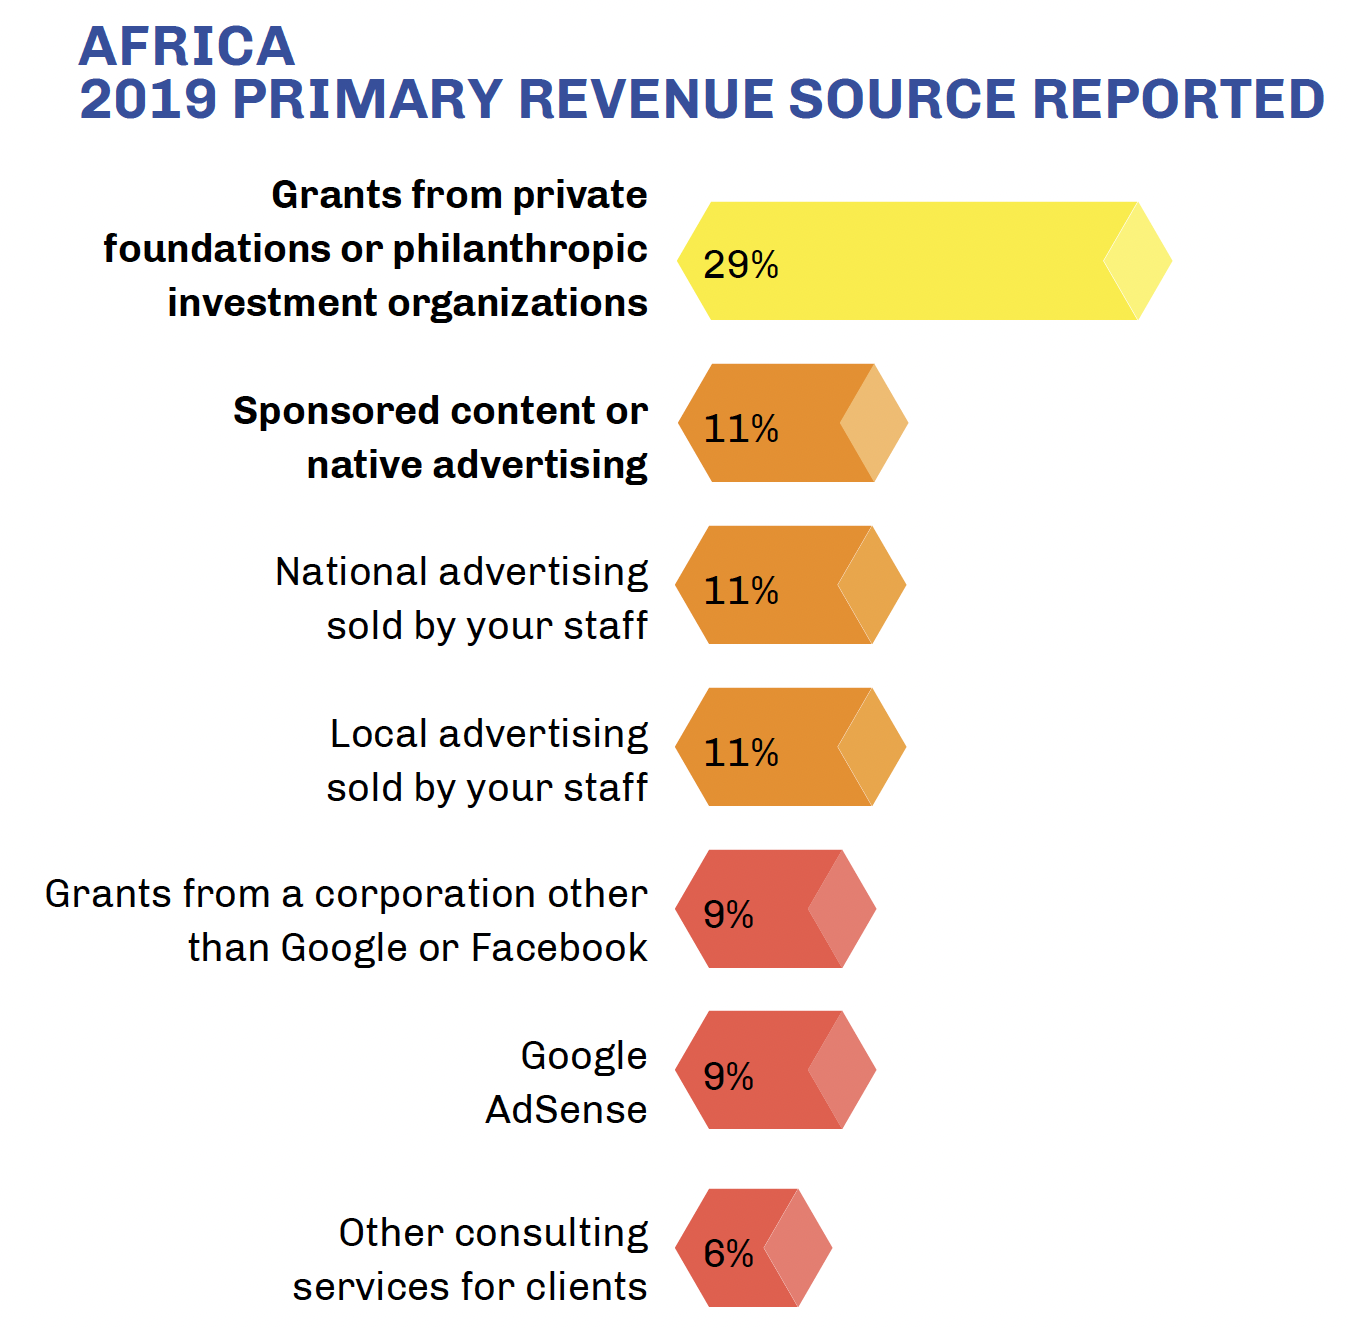
When all revenue from all sources was combined, advertising represented the largest category for the African newsrooms that reported financial data. In a departure from what we saw in the other regions, advertising among the African media in this study accounted for more than 29% of revenue in 2019, and 26% in 2020.
In contrast, grants made up just 16% of revenue for the African organizations that reported 2019 financial data, and almost 20% in 2020.
For example, Food For Mzansi in South Africa has been profitable since it launched in 2018 by selling sponsored content, sponsored events, native advertising, and website advertising packages.
The site has received funding from Google News Initiative’s Innovation Challenge for Africa and the Middle East, and Facebook’s COVID-19 emergency fund. But co-founder and editor-in-chief Ivor Price said the site’s diversified revenue model—which also includes revenue from Google AdSense and consulting services, among other sources—means “Food for Mzansi is everything but a news brand that is being kept alive by grants.”
Again, the small number of media that answered our financial questions in Africa, and the higher rates of reporting among larger media, may have skewed these results.
The risk of over-dependence on grant funding
It remains to be seen whether the increase in grant funding we found in 2019 and 2020 is a trend that will continue, or if these levels will recede. Interviews with grant funders confirm that a number of private foundations and corporate donors temporarily increased grant funding during the pandemic.
The existing economic challenges for news organizations that were exacerbated by the pandemic have led to a global movement to increase grant funding for media and even create a large fund to provide more grant funding and investment in the future.
The International Fund for Public Interest Media is an independent, multilateral initiative dedicated to supporting journalism in low- and middle-income countries as a key pillar of democracy. With funding from governments, corporations and development agencies, the Fund will support media outlets producing trustworthy coverage in the public interest. The Fund’s founding partners are Luminate and BBC Media Action. Additional operational funding has been provided by Craig Newmark Philanthropies, John D. and Catherine T. MacArthur Foundation, and National Endowment for Democracy.
Our analysis shows that grant funding has provided an important contribution to the development of independent digital media, especially in challenging markets and during unprecedented times, such as the pandemic.
However, we have found that media that become overly reliant on grants sometimes have a harder time building sustainable business models.
In our ongoing work with digital native media in Latin America, we’ve seen first hand how large grants to small media organizations can lead them to create larger journalism teams than they can sustainably support. This can lead to layoffs and, in some cases, media closures when grant programs end abruptly—especially when they come with no business support, or they include restrictions that the funds can only be spent on reporting projects.
That said, the fact that most of these media organizations are earning more than 70% of their revenue from other sources suggests that even those who receive grants are working toward building diverse business models.
Coping in Kenya during the pandemic
Founded in Kenya in 2018 with a mission to become regional leaders in mobile journalism storytelling, Mobile Journalism Africa was hard hit by the pandemic because their business model relied heavily on revenue from in-person training programs.
In their first two years, this young media business trained more than 1,000 students in Kenyan universities to cover stories using their smartphones. They also provided training sessions for content creators and non-media organizations.
Income from training, combined with grant funding, supported Mobile Journalism Africa’s team of five and made it possible for them to produce their own journalism and experiment with new formats and techniques, such as Snap Spectacles and 360 video.
The loss of training revenue during pandemic lockdowns meant they had to reduce the amount of reporting they could do, while the founders had to dip into savings and work to support the business through side hustle projects.
Advertising is the second most important revenue source
Advertising was the second largest revenue category in our global sample, making up just over 23% of total revenue in 2019, and almost 20% in 2020. Average ad revenue across all three regions was $27,903 in 2019, and $27,323 in 2020.
The drop in ad revenue in 2020 is consistent with the loss of advertising revenue experienced by many media around the world during the first year of the pandemic, although these digital native media organizations lost less revenue, as a percentage of income, than daily newspapers.

According to the Pew Research Center, newspaper ad revenue in the U.S. declined sharply in 2020. “Ad revenue totaled a record low $8.8 billion, down nearly 30% from $12.45 billion in 2019.”
In their study of the pandemic’s impact on independent news media, Reuters Institute found that commercial news media, which are often heavily reliant on advertising, with large newsrooms and print products to support, were more likely to suffer severe drops in revenue in 2020. Those who reported stable or increased revenue for that year were more likely to be smaller, online-only newsrooms, which are more similar to the digital native media in this report.
Comparing advertising revenue among the three regions, we found that:
- In Latin America, advertising accounted for 22% of total revenue in 2019, and 17% in 2020.
- In Southeast Asia ad revenue accounted for 25% of revenue in 2019, and 27% in 2020.
- The African sites in our sample reported 30% of their revenue came from advertising in 2019, and 27% in 2020.
To better appreciate the relatively small amount of revenue these media earn from advertising, it’s important to note that in 2019, the average amount of ad revenue for each of the media we studied in Latin America was $28,933. In Southeast Asia, the average revenue per media from ads was $35,285, and in Africa, it was $18,539.
Also of note, the most popular type of ad revenue reported by all of these media organizations in 2019 was sponsored content and native advertising, followed by Google AdSense, national advertising sold by a media organization’s staff, local advertising sold by an organization’s staff, and then services or advertising from a domestic government organization. (Again, it’s important to note that we excluded media from this study if we learned that they were overly reliant on government advertising.)
The best revenue sources at each business tier
When we analyzed the revenue sources that were most important in each of our four tiers of business development, a few trends emerged.
Media with audiences that were too small to earn significant revenue from advertising or audience support did better with business models built around consulting and content services.
Google AdSense was one of the most frequently reported types of advertising, appearing fifth on the list of the most popular revenue sources across media in all four tiers. Yet when we looked at the ad types that provided the most actual revenue, AdSense didn’t even make the top 10.
This is likely because it is relatively easy to sign up for AdSense and you only need to copy a few lines of code to a website to start earning revenue. But the ad rates media receive from AdSense are quite low compared with other advertising categories.
In contrast, in the top tier media in this study, which attract millions of pageviews each month, participation in programmatic ad exchanges was among the top five revenue sources.
This demonstrates one of the challenges for the smaller media in this study. Without significant traffic, they don’t even qualify for the higher ad rates that they could earn from programmatic advertising.
Even for media with large audiences, the complexities of ad tech optimization and their lack of dedicated technical teams make it harder for them to command the highest ad rates.
This is not a new problem, but our research confirms that these media are missing out on significant potential ad revenue because of these limitations.
Ads for News, a coalition of media organizations, marketing firms, and advertisers, managed by the nonprofit Internews, is already working to help independent media earn higher ad rates by creating “whitelists” of media, supporting ad tech optimization, and developing partnerships with premium advertisers that often overlook these smaller media players.
“Ads for News is a curated portfolio of trusted local news websites—screened by local partners to exclude content unsuitable for brands, such as disinformation. We make it easier for brands to reach audiences on trusted media, supporting real journalism and spending towards those who have earned it while experiencing the unparalleled benefits of advertising in quality news environments,” according to their website.
Full disclosure: SembraMedia is a partner in United for News, which created the Ads for News initiative.
In addition to white lists, helping smaller media combine forces or join existing media marketplaces that aggregate traffic from multiple media companies would almost certainly help them earn far higher ad revenue. But this is not a problem that can be fixed with limited training. Because most of these media also lack technical team members, they need specialized (and expensive) tech support to install ad management software and optimize the technology on their websites before they can participate in ad exchanges.

Consulting services drive revenues, even for the lower tiers
Consulting services represented almost 12% of total revenue for the media in this study in 2019. Examples of the type of consulting services entrepreneurs shared with us included: creating classes for NGOs and private companies; providing PR, marketing, and strategic communications services; and conducting surveys, polling, and other research.
But the proportion of revenue from consulting services varied quite dramatically from region to region. In Latin America, consulting revenue was reported as the third most important revenue source.
In Southeast Asia, consulting services was the second largest source, accounting for 29% of total revenue, but further analysis revealed this finding was skewed by an outlier. Most of the media in this region did not earn significant revenue in this category.
In Africa, the media that answered our financial questions reported almost no income from consultancy. We believe this finding warrants further study to better understand the types of consulting services that might work best in Africa and Southeast Asia because of the success of their Latin American peers with this model.
Many media leaders start building revenue with content services
After more than five years of research on digital native media in Latin America at SembraMedia, we’ve learned that syndicating content to other media is one of the first ways many journalism entrepreneurs start earning revenue. But in the detailed analysis we did for this report, we discovered that selling content to clients who are not media organizations produced higher revenues than content for other news organizations.
Across all the media in this study, content services were the fourth most important revenue source, representing more than 8% of global revenue in 2019. For the purpose of comparison, we combined all of the content services into this macro category, which includes content syndication, unique content created for other media, content created for non-media clients, and design or tech services.
But when we looked at the most important revenue sources broken out across our list of 30 revenue types, “content for non-media clients” was the second-most important revenue source overall, and content for other media didn’t even make the top 10.
In both Latin America and Asia, all of these content services amounted to nearly 10% of total revenue, but again Africa was an outlier. None of the media there that answered our revenue questions reported significant income from content sales or syndication. This suggests that media in Africa could open up new revenue streams by replicating the types of content services that have been created by their colleagues in Asia and Latin America.
Content services support Philippines’ first podcast production house
Puma Podcast is the first podcast and audio-storytelling production studio in the Philippines, with a business model built around content services for media and non-media clients.
Puma was founded in 2019, with a mission to produce independent journalism through high-quality audio storytelling. But as a startup in a market where high-quality audio was not yet part of mainstream media strategies or media consumption habits, founder Roby Alampay recognized they would not be able to monetize the content right away.
So they used seed investment and grant funding in their first two years to develop “prestige products,” including an award-winning six-part series examining President Rodrigo Duterte’s war on drugs and the Philippines’ first serialized true-crime podcast.
These prestige products served as proof of concept when pitching to potential clients, allowing Puma to reduce their reliance on grant funding.
In 2020, 80% of their revenue came from grants and 20% from content services. Today, they have flipped this ratio, with 70% of their revenue coming from content services to media and non-media clients and only 30% from grant support. Most importantly, the client services serve to subsidize the independent journalism that remains at the core of Puma’s values and mission.
They produce seven podcasts for their primary media client, the leading broadsheet newspaper, the Philippine Daily Inquirer. Their non-media clients include the maritime conservation NGO Rare, for whom they produce a podcast about food security and livelihoods in coastal communities. They also produce a podcast about financial tech and inclusion for the Filipino bank RCBC.
As they look ahead, Puma’s founders said they plan to monetize their own podcasts through a mix of traditional ad placements, sponsored episodes, and licensing. They are also developing audio storytelling formats beyond podcasting, with applications for community organizing, education, museums, and more.
Reader revenue still small, but growing
To best represent the many ways media earn revenue directly from their audiences, we combined six of our 30 revenue types to create the macro Reader Revenue category.
Of those six, the most popular type of reader revenue reported was donations from individuals, followed by membership programs, crowdfunding, event tickets sales, subscriptions to a news site, and then subscriptions to newsletters.
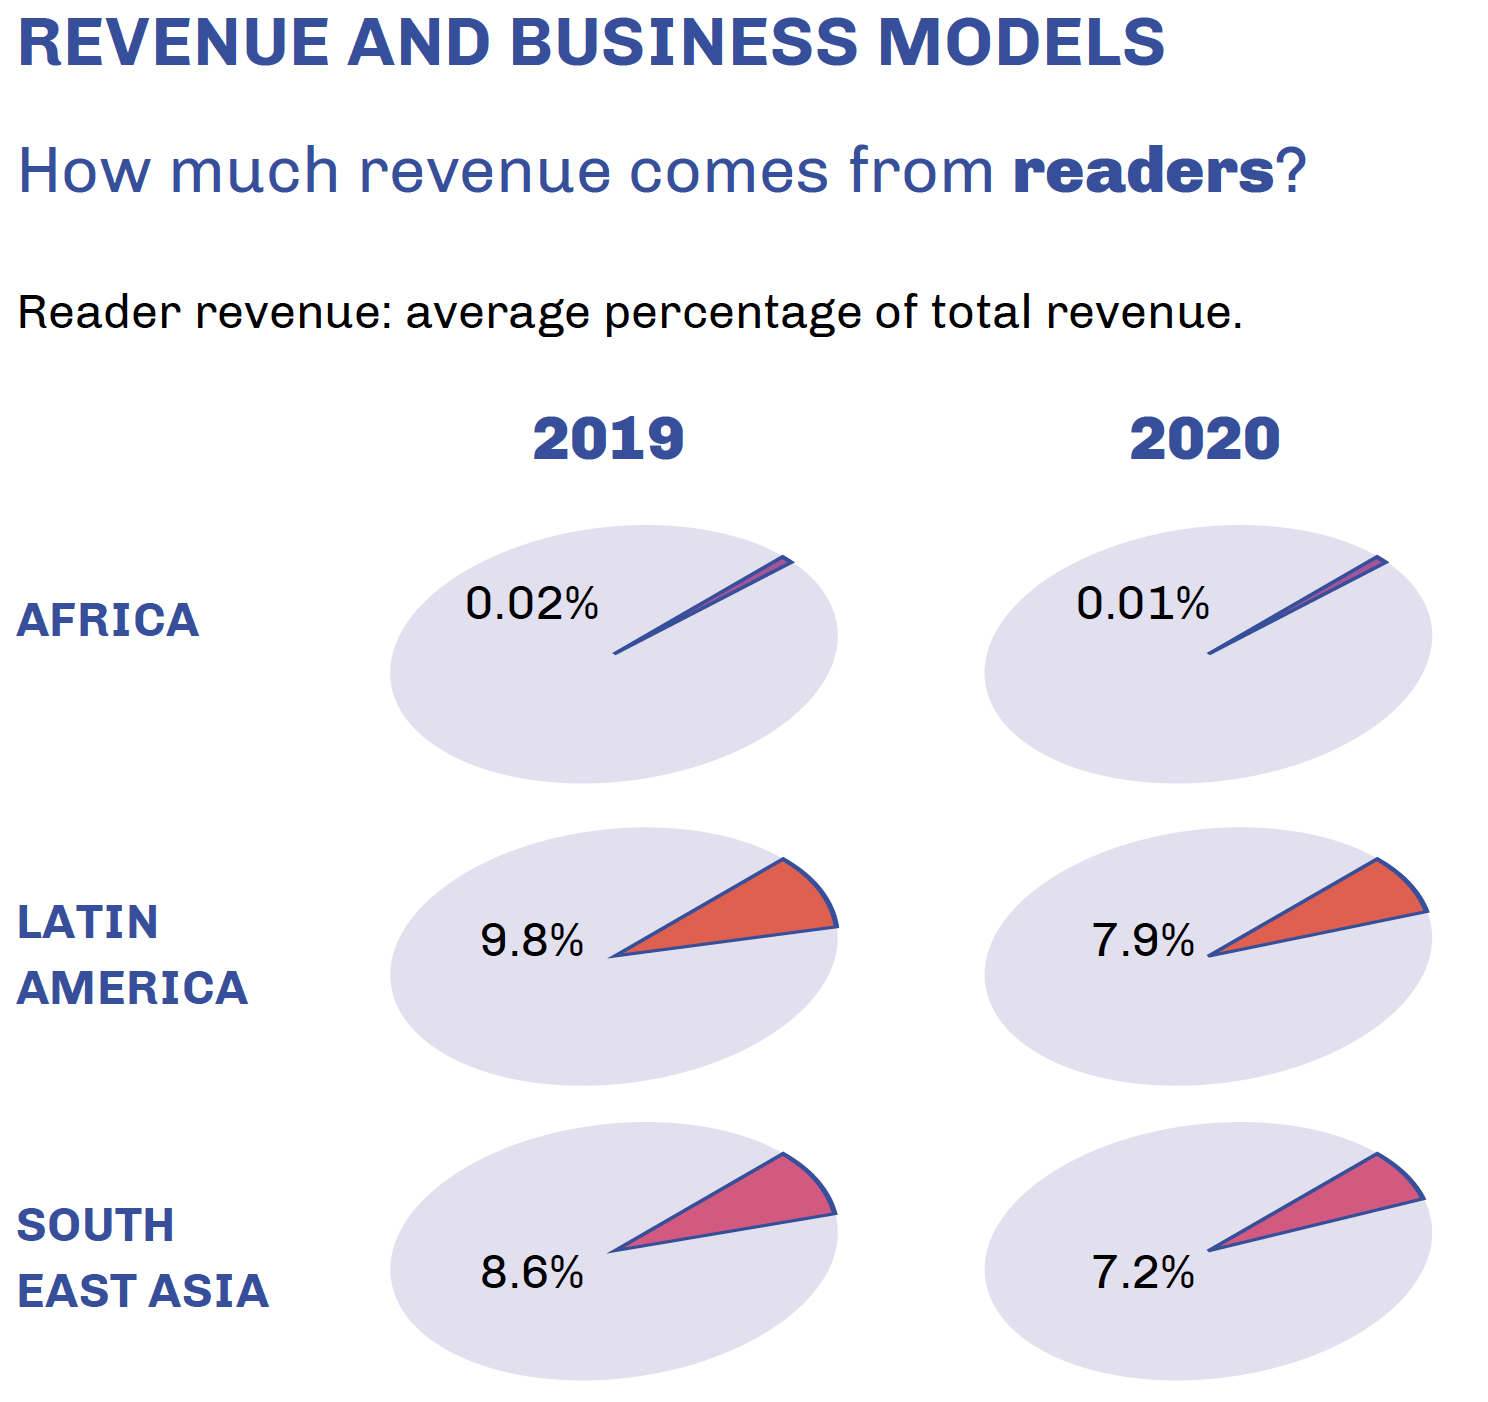
The combined value of all of these audience-based sources represented 8% of total revenue in 2019. Notably, that percentage dropped to 6.5% in 2020.
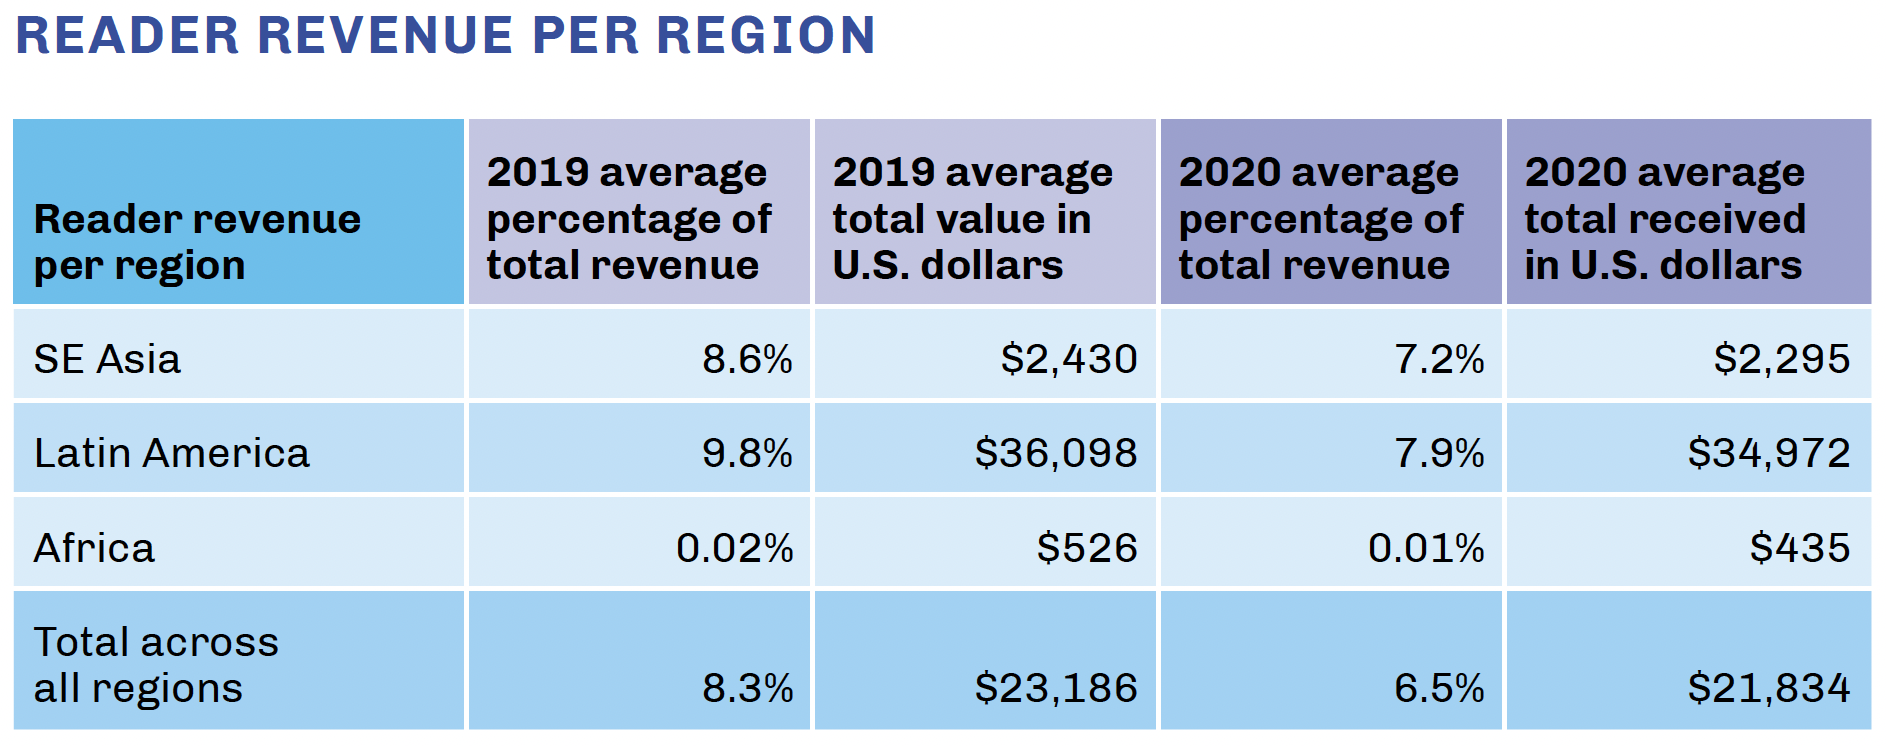
In Latin America, reader revenue nearly doubled between the first Inflection Point study in 2016—when subscriptions and membership accounted for about 5% of average total revenue—to nearly 10% in 2019. Donations from individuals and membership programs were the most popular sources of reader revenue in Latin America.
While this still represents a fairly small portion of most media organizations’ revenue pie, this growth is an encouraging sign of the potential for reader revenue in the region.
In a 2020 study of subscription models in Latin America, Luminate found that 13% of news consumers in the region were paying for at least one news subscription or service.
“While relatively modest, these figures show that willingness to pay for digital news amongst consumers in Latin America is higher than in some other countries, including established markets such as the U.K. (8%) and Germany (10%) and is not far behind the U.S. (20%).”
Luminate’s audience study also found that media that were perceived to operate with greater independence from political influence scored higher among consumers when they were asked what types of media they would pay to read.
Reader support was lower in Africa and Southeast Asia
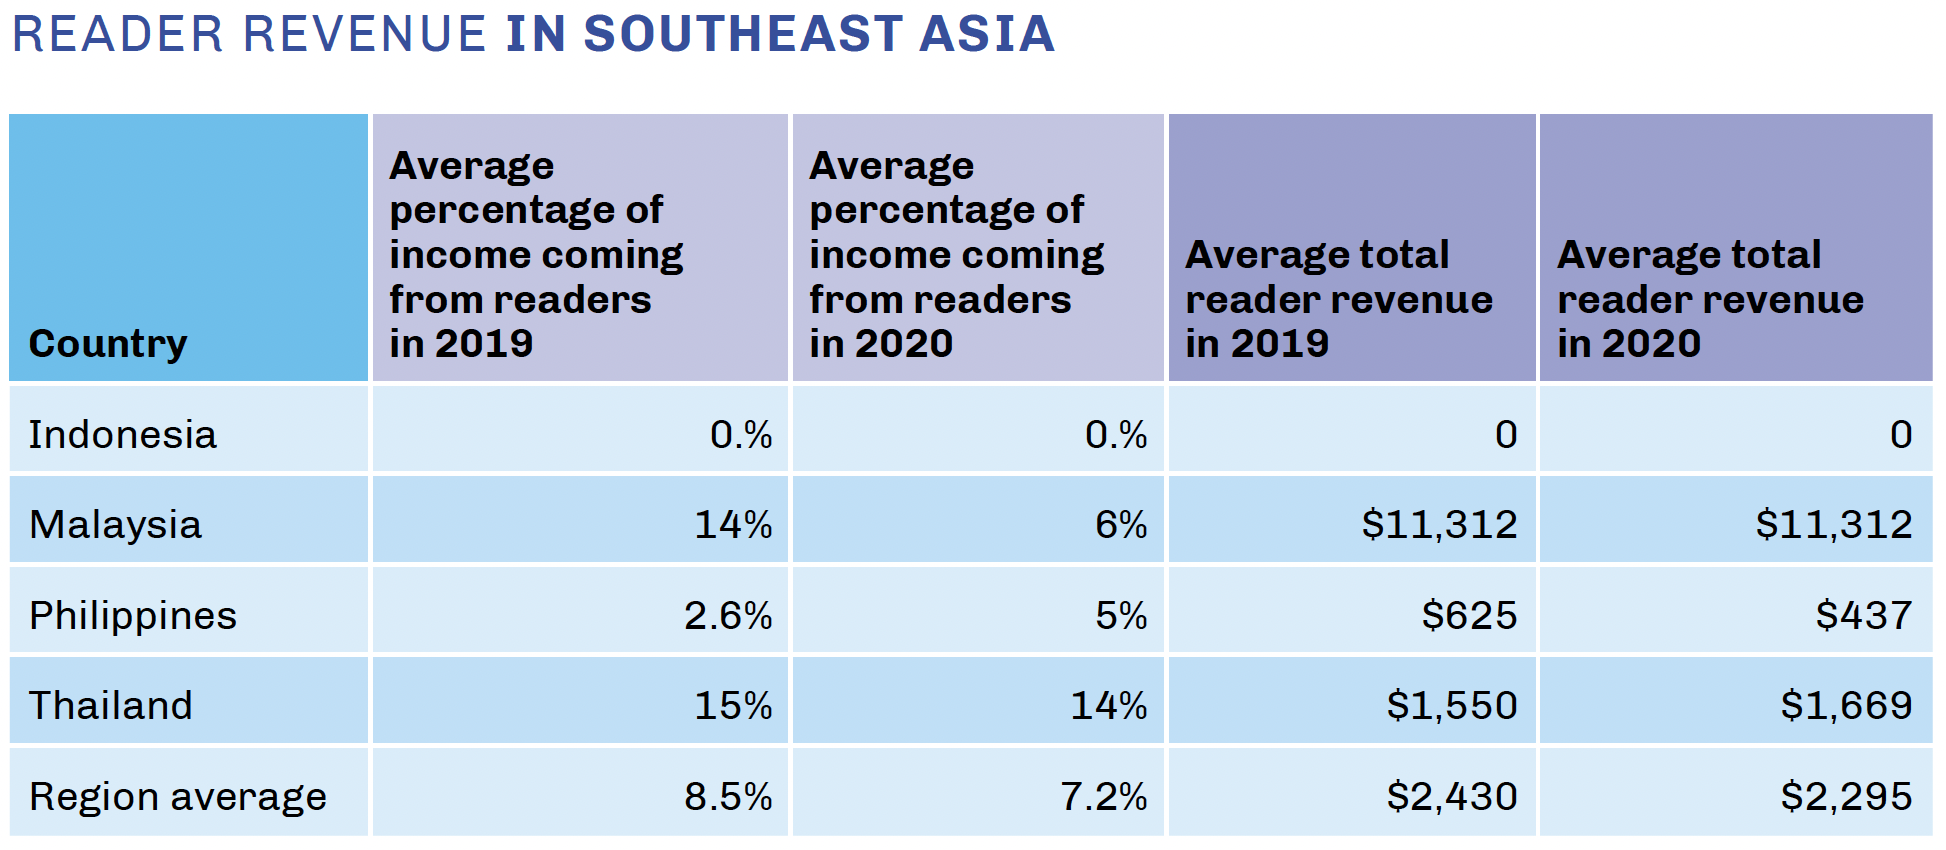
Average reader revenue in Southeast Asia was $2,430 in 2019 (compared to $36,098 in Latin America), accounting for 8.5% of total revenue in 2019.
The most popular source of reader revenue in Southeast Asia was donations from individuals. Overall, only 14 organizations from our sample of 52 media in Southeast Asia reported any form of reader revenue, but there were significant variations by country, as illustrated in following graphic.
A few outliers reported high rates of reader revenue
In every region we studied, there were outliers who were generating significant revenue from reader sources.
In Brazil, JOTA reported approximately $1.4 million in revenue from site subscriptions in 2019 and $2 million in 2020. On average, the site has been growing subscription revenue 40-50% per year.
Congo in Argentina was notable for listing membership as its primary source of revenue in 2019 and 2020, with this figure more than doubling between the two years.
While in Southeast Asia, regional outlet New Naratif reported significant membership revenue.
What drives reader revenue
Despite considerable statistical analysis, we found no definitive recipe for a successful reader revenue program. For example, there was no clear relationship between higher reader revenue and the type of journalism or topics an outlet covered.
Our findings are also in line with previous research by the Membership Puzzle Project (MPP) suggesting financial contributions to media organizations are likely to come from a small, loyal proportion of the audience—a maximum of 10% of a site’s overall audience, unless the organization has an exceptionally engaged audience. During its four years of research, MPP also found that the majority of media ventures pursuing membership would see it make up 10% of revenue or less in the early years of a membership program.
We did find a correlation between the number of pageviews and reader revenue in this study, and although it was not a significant correlation, it is consistent with other research that suggests a larger audience can be one factor in the success of membership programs, subscription rates, and event income. Even with a small percentage of conversions, more people at the top of the audience funnel has the potential to result in more subscribers, members, or event attendees.
The relatively low level of revenue in this category is likely due to multiple factors, including:
- Many of the media that did report having membership programs started in the last year or two, and other research suggests reader revenue initiatives take time to grow, sustain, and retain.
- In many of the markets we studied, consumer habits around paying for news are still developing.
- Consumer spending power is often more limited than in regions such as North America and Europe, where reader revenue models are more firmly established and more extensively studied.
Even for those outlets where reader revenue represented just a fraction of their overall revenue, it’s worth noting that many said reader engagement projects such as membership were about more than just generating cash.
As the Membership Puzzle Project’s Membership Guide says: “Membership is more than just a piece of a revenue pie. Membership is a relationship between a newsroom and its supporters that treats audience members as core participants and stakeholders.”
El Gato y la Caja in Argentina, for example, asks its community to complete questionnaires that allow them to get data and scientifically test hypotheses.
ConexiónMigrante, based in Mexico, offers free membership to their audience, which is made up primarily of immigrants in the U.S. In addition to gaining access to the community, members receive discounts on products or services from sponsors.
In addition to publishing articles and other information, ConexiónMigrante runs a Migrant Service Center where they answer phone calls, and respond to questions they receive through Facebook, WhatsApp, and email. “We started the call center because someone sent us a voice message to tell us that they could not read or write, but that they needed help,” said founder and director Patricia Mercado.

